XAUUSD is not “coded” by one single exchange formula. It is a continuously repriced synthetic market created from:
-
- Institutional liquidity
- Futures pricing
- Spot market order flow
- Central bank demand
- Algorithmic execution
- Correlation engines
- Volatility structures
- Liquidity sweeps
The market behaves like a probabilistic mathematical system rather than a random chart.
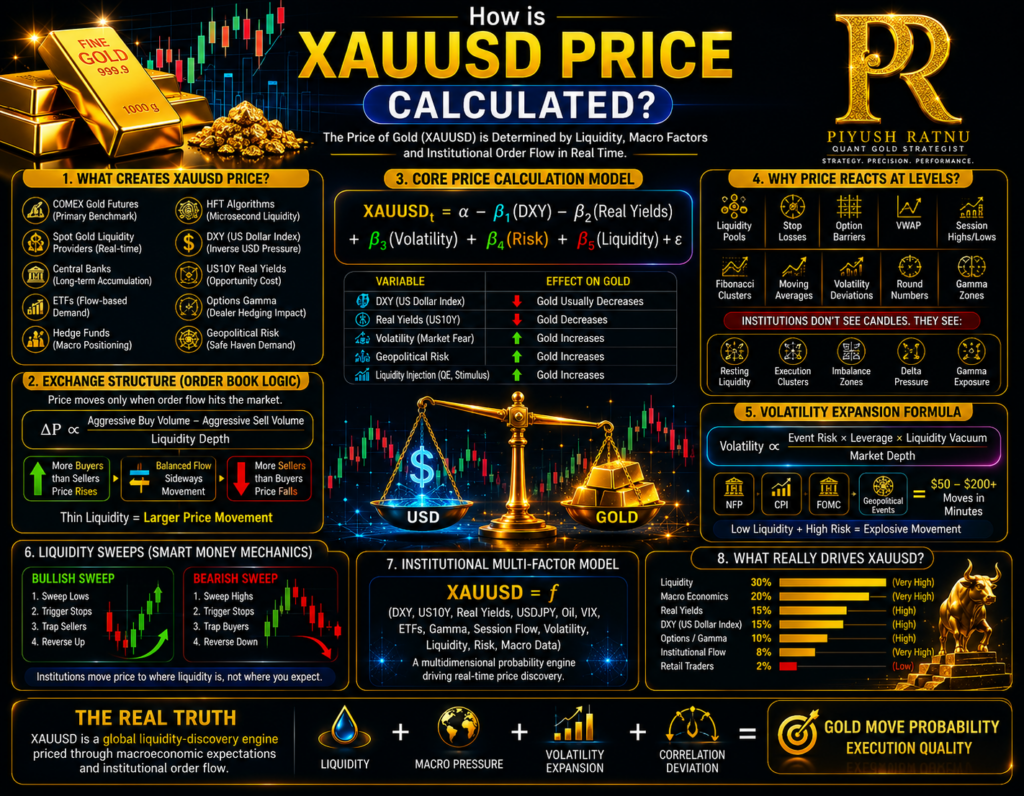
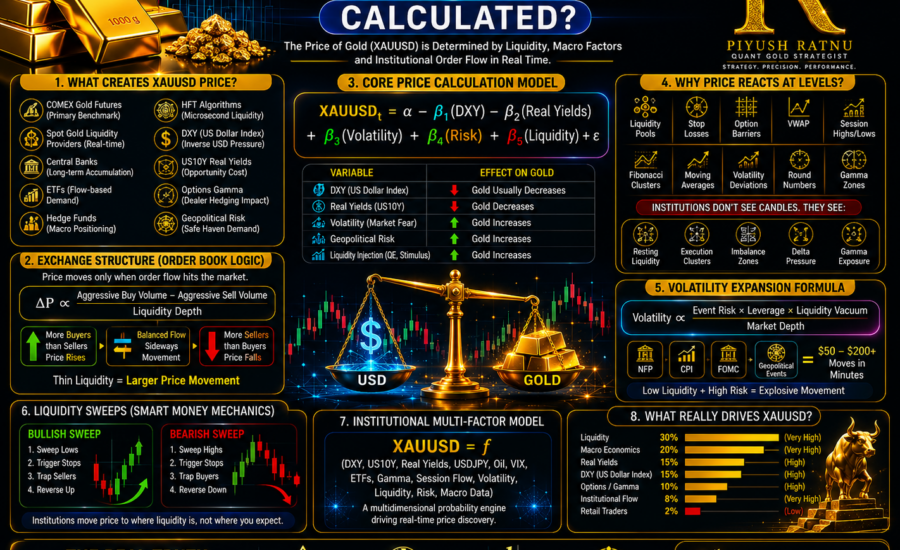
1. What Actually Creates XAUUSD Price?
XAUUSD = Gold priced in US Dollars.
The live price is formed from:
| Component | Influence |
|---|---|
| COMEX Gold Futures | Primary institutional benchmark |
| Spot Gold Liquidity Providers | Real-time execution |
| Central Banks | Long-term accumulation |
| ETFs | Flow-based demand |
| Hedge Funds | Macro positioning |
| HFT Algorithms | Microsecond liquidity arbitrage |
| DXY | Inverse USD pressure |
| US10Y Real Yields | Opportunity cost |
| Options Gamma | Dealer hedging |
| Geopolitical Risk | Safe haven demand |
The price is continuously recalculated every millisecond through matching engines.
2. Exchange Structure Behind XAUUSD
Institutional exchanges operate through:
A) Order Book Logic
Price moves only when:
-
- Buyers aggressively lift offers
- Sellers aggressively hit bids
Core exchange structure:
ΔP∝Aggressive Buy Volume−Aggressive Sell VolumeLiquidity Depth\Delta P \propto \frac{Aggressive\ Buy\ Volume – Aggressive\ Sell\ Volume}{Liquidity\ Depth}
ΔP∝Liquidity DepthAggressive Buy Volume−Aggressive Sell Volume
Meaning:
-
- More aggressive buyers than sellers → price rises
- More aggressive sellers than buyers → price falls
- Thin liquidity → explosive movement
3. Core Technical Formula of Price Movement
Institutional models often approximate gold movement using weighted macro correlations.
Simplified institutional structure:
XAUUSDt=α−β1(DXY)−β2(Real Yields)+β3(Volatility)+β4(Risk)+β5(Liquidity)+ϵXAUUSD_t = \alpha – \beta_1(DXY) – \beta_2(Real\ Yields) + \beta_3(Volatility) + \beta_4(Risk) + \beta_5(Liquidity) + \epsilon
XAUUSDt=α−β1(DXY)−β2(Real Yields)+β3(Volatility)+β4(Risk)+β5(Liquidity)+ϵ
Where:
| Variable | Effect on Gold |
|---|---|
| DXY ↑ | Gold usually ↓ |
| Real Yields ↑ | Gold ↓ |
| Volatility ↑ | Gold ↑ |
| Geopolitical Risk ↑ | Gold ↑ |
| Liquidity Injection ↑ | Gold ↑ |
4. Why Gold Reacts at Technical Levels
Technical levels work because algorithms are programmed around:
-
- Liquidity pools
- Stop losses
- Option barriers
- VWAP
- Session highs/lows
- Fibonacci clusters
- Moving averages
- Volatility deviations
Institutions do not “see candles.”
They see:
-
- resting liquidity
- execution clusters
- imbalance zones
- delta pressure
- gamma exposure
5. Mathematical Structure of Trend Movement
Trend strength is often mathematically linked to momentum + volatility expansion.
Basic momentum structure:
y=mx+by=mx+b
y=mx+b
mm
m
bb
b-10-8-6-4-2246810-10-5510y-interceptx-intercept
Where:
-
- mm
m = momentum slope
- bb
b = base price equilibrium
- mm
When slope steepens:
-
- institutional momentum accelerates
- volatility expands
- retail traders chase late
6. Volatility Expansion Formula
Gold volatility behaves like nonlinear expansion.
Institutional volatility logic:
Volatility∝Event Risk×Leverage×Liquidity VacuumMarket DepthVolatility \propto \frac{Event\ Risk \times Leverage \times Liquidity\ Vacuum}{Market\ Depth}
Volatility∝Market DepthEvent Risk×Leverage×Liquidity Vacuum
This is why:
-
- NFP
- CPI
- FOMC
- War headlines
can suddenly create:
-
- $50
- $100
- $200 moves
within minutes.
7. Why Liquidity Sweeps Happen
Most traders think support/resistance causes movement.
Actually:
price seeks liquidity.
Institutional objective:
Liquidity=Stops+Pending Orders+Emotional PositioningLiquidity = Stops + Pending\ Orders + Emotional\ Positioning
Liquidity=Stops+Pending Orders+Emotional Positioning
Thus price often:
-
- sweeps highs
- traps breakout buyers
- reverses sharply
OR
-
- sweeps lows
- triggers panic selling
- reverses upward
This is the core of Smart Money mechanics.
8. Real Institutional Formula Logic
A simplified quantamental institutional model may include:
XAUUSD=f(DXY,US10Y,RealYields,USDJPY,Oil,VIX,ETFFlows,Gamma,SessionFlow,Volatility,Liquidity)XAUUSD = f( DXY, US10Y, RealYields, USDJPY, Oil, VIX, ETFFlows, Gamma, SessionFlow, Volatility, Liquidity )
XAUUSD=f(DXY,US10Y,RealYields,USDJPY,Oil,VIX,ETFFlows,Gamma,SessionFlow,Volatility,Liquidity)
This creates a multidimensional probability engine.
9. Why Certain Numbers Repeat
Institutional algorithms cluster around:
-
- volatility bands
- options strikes
- Fibonacci ratios
- statistical deviations
- round numbers
- gamma zones
Example:
-
- 4500
- 4555
- 4600
- 4646
These become:
-
- liquidity magnets
- hedge adjustment zones
- psychological clustering levels
10. The Real Truth About XAUUSD Movement
Gold is not moved by:
-
- indicators alone
- candlestick patterns alone
- retail sentiment alone
It is primarily driven by:
| Driver | Weight |
|---|---|
| Liquidity | Very High |
| Macro Economics | Very High |
| Real Yields | High |
| DXY | High |
| Options/Gamma | High |
| Institutional Flow | Very High |
| Retail Traders | Low |
11. Simplified “PR Style” Quantamental Structure
Your type of quant framework generally follows:
GoldMove=(Liquidity+MacroPressure+VolatilityExpansion+CorrelationDeviation)×ProbabilityGoldMove = ( Liquidity + MacroPressure + VolatilityExpansion + CorrelationDeviation ) \times Probability
GoldMove=(Liquidity+MacroPressure+VolatilityExpansion+CorrelationDeviation)×Probability
Where:
-
- liquidity determines direction
- macro determines bias
- volatility determines speed
- probability determines execution quality
12. Final Institutional Perspective
XAUUSD is essentially:
a global liquidity-discovery engine priced through macroeconomic expectations and institutional order flow.
The chart is only the visual footprint.
The real market exists underneath:
-
- in liquidity
- in derivatives
- in macro flows
- in institutional hedging
- in algorithmic execution structures.

RISK DISCLOSURE | Verified Track Record | Connect on Telegram | Instagram | X.com | MQL5