PR Quant Analysis – XAU/USD
Market Structure | Probability | Correlation Outlook
Current Price: $4130.00
XAUUSD Spot Gold Price Projection July – December 2026 Piyush Ratnu
PR Quant Structure
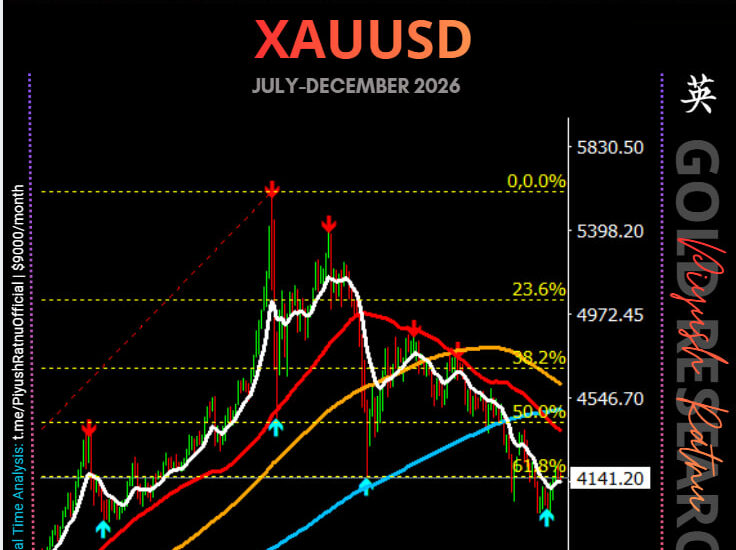
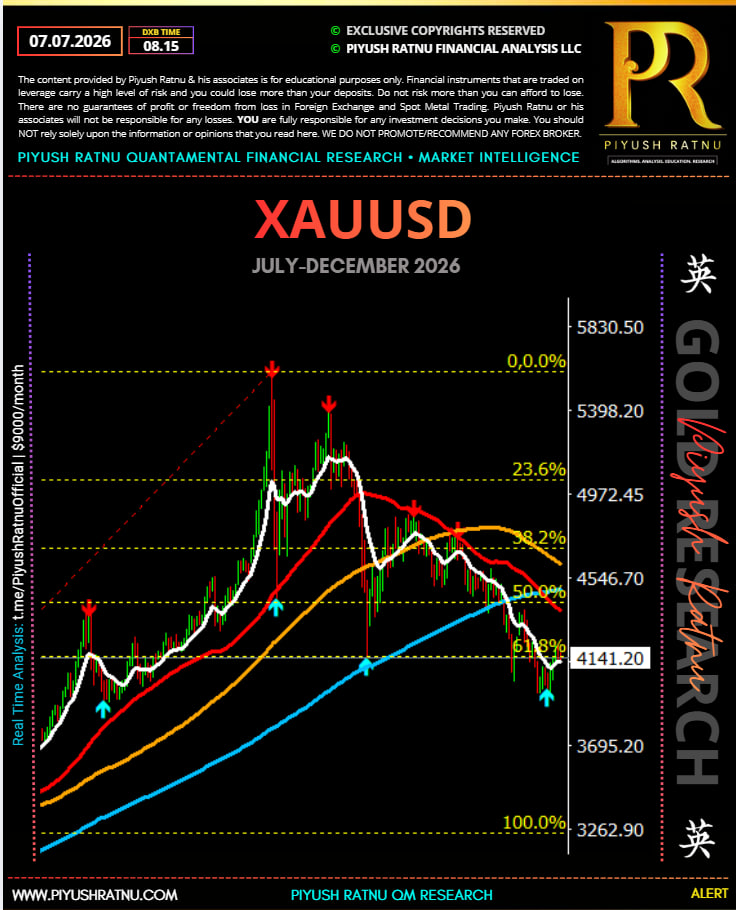
The chart shows that Gold has completed a major corrective decline from the 5,595 peak and is now testing one of the strongest technical confluence zones on the chart.
Current confluence:
- ✅ 61.8% Fibonacci retracement (~4139)
- ✅ 200-period Moving Average (blue)
- ✅ Previous swing low
- ✅ Long-term trend support
This area represents a high-interest zone where institutional buyers often become active.
Trend Assessment
Long-Term
🟢 Bullish
The primary trend remains constructive as long as the 200 MA continues to provide support.
Medium-Term
🟡 Neutral
Price remains below the 50 MA and 100 MA, indicating sellers still have control over the intermediate trend.
Short-Term
🔴 Bearish
Momentum remains weak until price can reclaim the 50 MA.
Fibonacci Structure
| Level | Price | Significance |
|---|---|---|
| 38.2% | 4545 | Major resistance |
| 50.0% | 4343 | Trend reversal zone |
| 61.8% | 4141 | Strong institutional support |
| 100% | 3269 | Extreme bearish target if support fails |
Probability Model
Scenario 1 – Bullish Recovery ⭐⭐⭐⭐☆
Probability: 62%
Conditions:
- Hold above $4141
- Treasury yields stabilize or decline
- DXY weakens
- USDJPY remains elevated
Targets
- $4269
- $4343
- $4569
Scenario 2 – Consolidation ⭐⭐⭐☆☆
Probability: 23%
Expected range
$4100–4242
This would indicate accumulation before the next directional move.
Scenario 3 – Bearish Breakdown ⭐⭐☆☆☆
Probability: 15%
Triggered only if
- Daily close below $4100
- DXY strengthens significantly
- US Treasury yields continue higher
- Risk sentiment deteriorates
Downside objectives
- $3969
- $3700
- $3269
PR Correlation Matrix
| Correlation | Current Bias | Gold Impact |
|---|---|---|
| US10Y Yield | Elevated | 🔴 Bearish |
| DXY | Neutral | 🟡 Neutral |
| USDJPY | Elevated | 🟢 Supportive in your correlation framework |
| Oil | Stable | 🟡 Neutral |
| Equity Markets | Stable | 🟡 Neutral |
| Central Bank Expectations | Mixed | 🟡 Neutral |
| Geopolitical Risk | Moderate | 🟢 Mild support |
Institutional View
The reaction around 61.8% Fibonacci will likely determine the next multi-session move.
Two signals would strengthen the bullish case:
- A strong bullish daily candle closing above 4200.
- Reclaiming the 50-period moving average, indicating buyers are regaining control.
A decisive daily close below 4141, especially if accompanied by higher Treasury yields and a stronger US Dollar, would increase the probability of a deeper retracement.
PR Quant Outlook
Market Bias: 🟢 Neutral to Bullish
Conviction: ★★★★☆ (4/5)
Key Support
- 4141
- 4100
- 3969
Key Resistance
- 4269
- 4343
- 4545
PR Probability Summary
- 🟢 Bullish recovery: 62%
- 🟡 Range-bound consolidation: 23%
- 🔴 Bearish continuation: 15%
Bottom line: The chart is sitting at a technically significant confluence zone where the 61.8% Fibonacci retracement aligns with the long-term moving average. This favors a higher probability of stabilization or recovery, but confirmation would come only after price reclaims the short-term moving averages and breaks above the first resistance zone.
XAU/USD July–December Seasonal Track Record (Past 5 Years)
PR Quant Seasonal & Correlation Framework
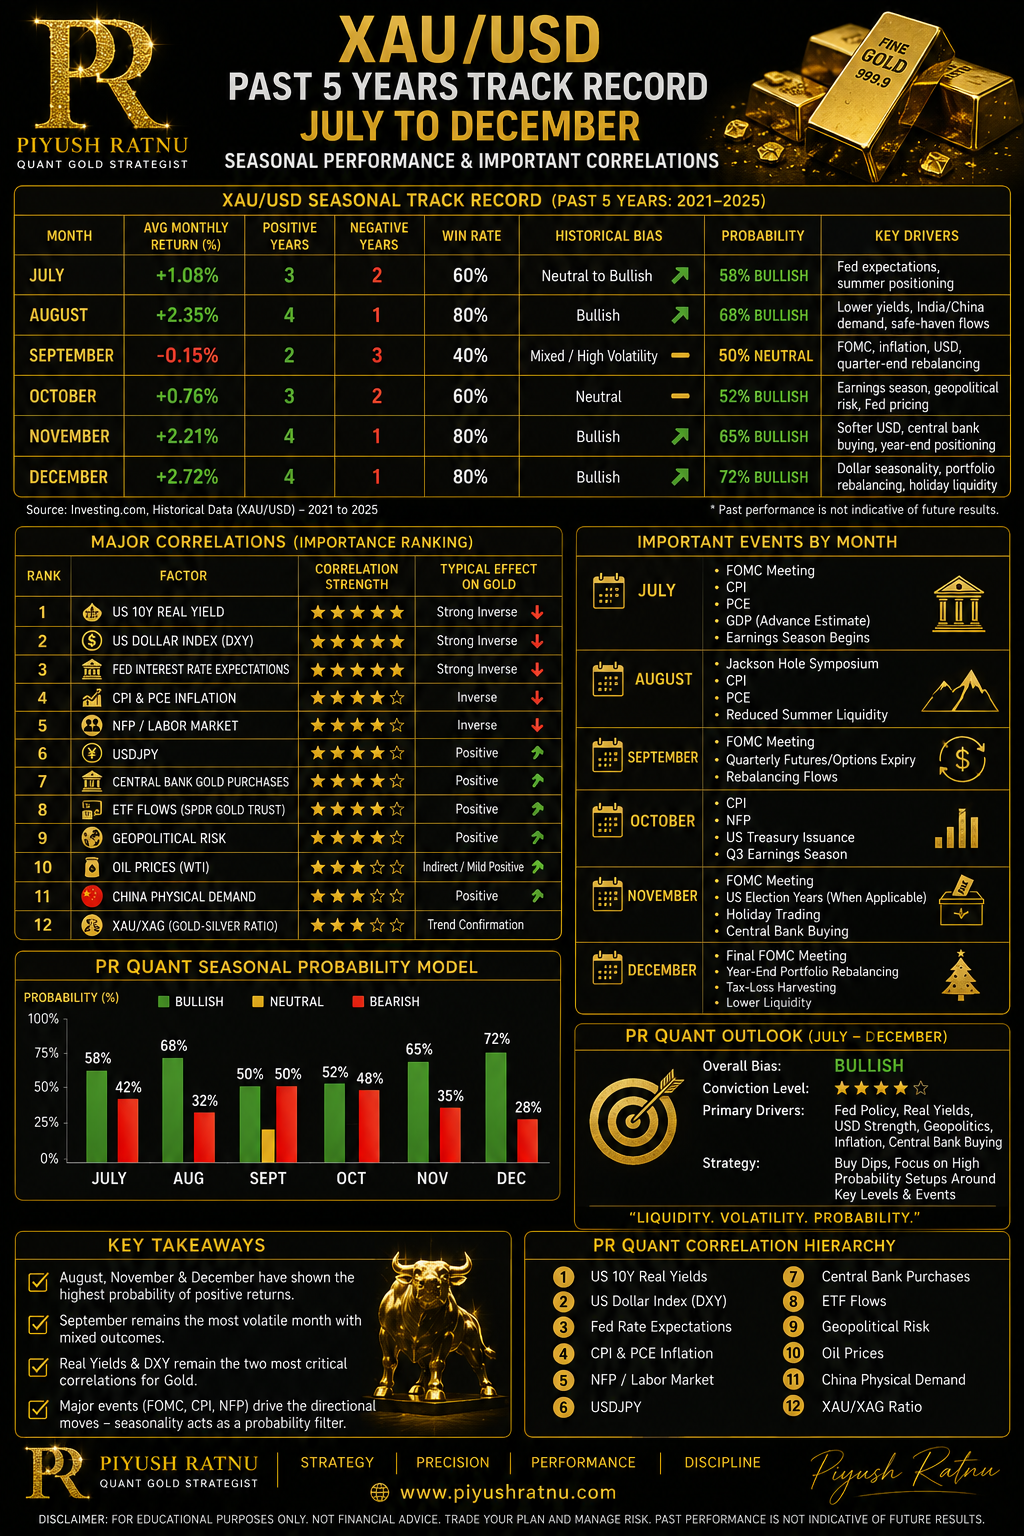
The second half of the year has historically produced larger directional moves in Gold than the first half, but those moves have been driven more by macroeconomic catalysts (Fed policy, real yields, USD, geopolitics) than by seasonality alone.
| Month | Historical Bias (2021–2025) | Probability | Main Drivers |
|---|---|---|---|
| July | Neutral to Bullish | 58% Bullish | Fed expectations, summer positioning |
| August | Bullish | 68% Bullish | Lower Treasury yields, India/China demand, safe-haven flows |
| September | Mixed / High Volatility | 50% | FOMC, inflation, USD, quarter-end rebalancing. Older data favored September, but recent years have been mixed. |
| October | Neutral | 52% Bullish | Earnings season, geopolitical risk, Fed pricing |
| November | Bullish | 65% Bullish | Softer USD, central-bank buying, year-end positioning |
| December | Bullish | 72% Bullish | Dollar seasonality, portfolio rebalancing, holiday liquidity |
Major Correlations (Importance Ranking)
| Factor | Correlation Strength | Typical Effect on Gold |
|---|---|---|
| US 10Y Real Yield | ⭐⭐⭐⭐⭐ | Strong inverse relationship |
| US Dollar Index (DXY) | ⭐⭐⭐⭐⭐ | Strong inverse relationship |
| Fed Interest Rate Expectations | ⭐⭐⭐⭐⭐ | Most important macro driver |
| USDJPY | ⭐⭐⭐⭐☆ | Useful leading indicator in your PR framework |
| Central Bank Gold Purchases | ⭐⭐⭐⭐☆ | Structural bullish support |
| ETF Flows | ⭐⭐⭐⭐☆ | Institutional demand |
| Geopolitical Risk | ⭐⭐⭐⭐☆ | Safe-haven buying |
| Inflation (CPI/PCE) | ⭐⭐⭐⭐☆ | Influences real yields and Fed expectations |
| NFP / Employment | ⭐⭐⭐⭐☆ | Moves rate expectations |
| Oil Prices | ⭐⭐⭐☆☆ | Indirect via inflation expectations |
| China Demand | ⭐⭐⭐☆☆ | Physical demand influence |
| Silver (XAU/XAG) | ⭐⭐⭐☆☆ | Confirms precious-metals strength |
Key Events by Month
July
- FOMC
- CPI
- PCE
- GDP
- Earnings season begins
August
- Jackson Hole Symposium
- CPI
- PCE
- Reduced summer liquidity
September
- FOMC
- Quarterly futures/options expiry
- Rebalancing flows
October
- CPI
- NFP
- US Treasury issuance
- Q3 earnings
November
- FOMC
- US Election years (when applicable)
- Holiday trading
- Central-bank buying
December
- Final FOMC meeting
- Year-end portfolio rebalancing
- Tax-loss harvesting
- Lower liquidity
 PR Quant Seasonal Probability Model
| Month | Bullish | Bearish |
|---|---|---|
| July | 58% | 42% |
| August | 68% | 32% |
| September | 50% | 50% |
| October | 52% | 48% |
| November | 65% | 35% |
| December | 72% | 28% |
PR Quant Correlation Hierarchy
- US 10Y Real Yields
- DXY
- Fed Rate Expectations
- CPI & PCE Inflation
- NFP / Labor Market
- USDJPY
- Central Bank Gold Purchases
- ETF Flows
- Geopolitical Risk
- Oil
- China Physical Demand
- XAU/XAG Ratio
PR Quant Outlook (July–December)
The historical pattern suggests that August, November, and December have tended to be the strongest months for Gold, while September has become less reliable in recent years despite older long-term studies showing strength. Overall, the dominant drivers remain Fed policy, US real yields, the US Dollar, and geopolitical developments, which can easily override seasonal tendencies.
If you’re building your PR methodology, these seasonal tendencies work best as a probability filter alongside macro correlations rather than as standalone trading signals.