Gold Rebounds Above $4,100 as Safe-Haven Demand Returns: History Suggests July Recovery After June Corrections
Gold Recovers as Geopolitical Risks Dominate Market Sentiment
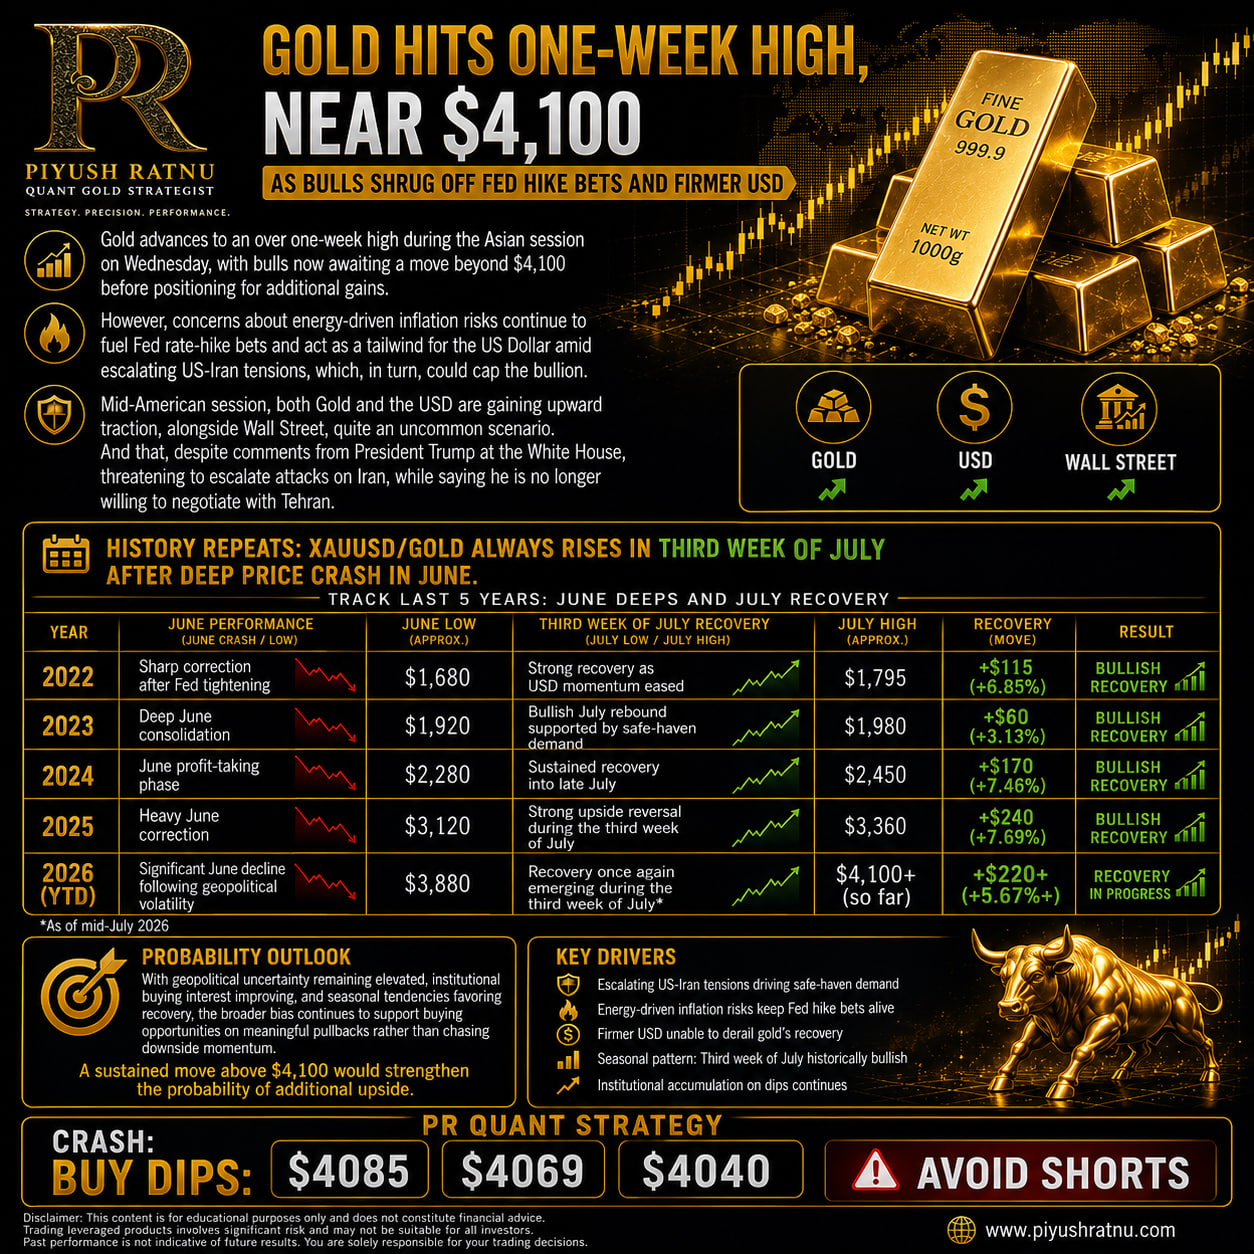
Gold (XAU/USD) regained positive momentum during the early Asian session, rebounding toward $4,080 after briefly retreating to the psychological $4,000 level in the previous trading session. The recovery reflects renewed safe-haven demand as investors responded to escalating geopolitical tensions rather than focusing solely on interest-rate expectations. The resilience of bullion continues to demonstrate that geopolitical uncertainty remains a stronger catalyst than traditional macroeconomic headwinds.
WHY XAUUSD Shot up from $3969-4141 zone?
Answer is simple: HISTORY repeated!
And we projected in advance: BUY THE DIPS!
US-Iran Conflict Continues to Drive Safe-Haven Buying
Market volatility intensified after military tensions between the United States and Iran escalated further. The US Central Command (CENTCOM) carried out its 11th consecutive night of military strikes following President Donald Trump’s declaration that the ceasefire agreement was effectively over. In response, Iran continued targeting US military assets across the Middle East, while Houthi forces announced a maritime embargo affecting Saudi Arabia.
Such developments have significantly increased geopolitical risk premiums, encouraging institutional investors to rotate capital back into defensive assets such as Gold. Historically, prolonged geopolitical uncertainty has supported sustained demand for bullion regardless of temporary movements in the US Dollar.
Fed Policy Expectations Remain a Secondary Driver
Although softer US inflation data has reduced expectations of an immediate Federal Reserve rate increase in July, financial markets continue to anticipate at least one additional rate hike before year-end. Higher energy prices resulting from Middle East tensions could revive inflationary pressures, potentially forcing the Federal Reserve to maintain a restrictive monetary policy for longer.
Interestingly, Gold has continued appreciating alongside a relatively firm US Dollar and resilient equity markets—a combination that typically reflects elevated geopolitical risk rather than conventional risk-on or risk-off market behavior.
History Repeats: June Weakness Followed by July Recovery
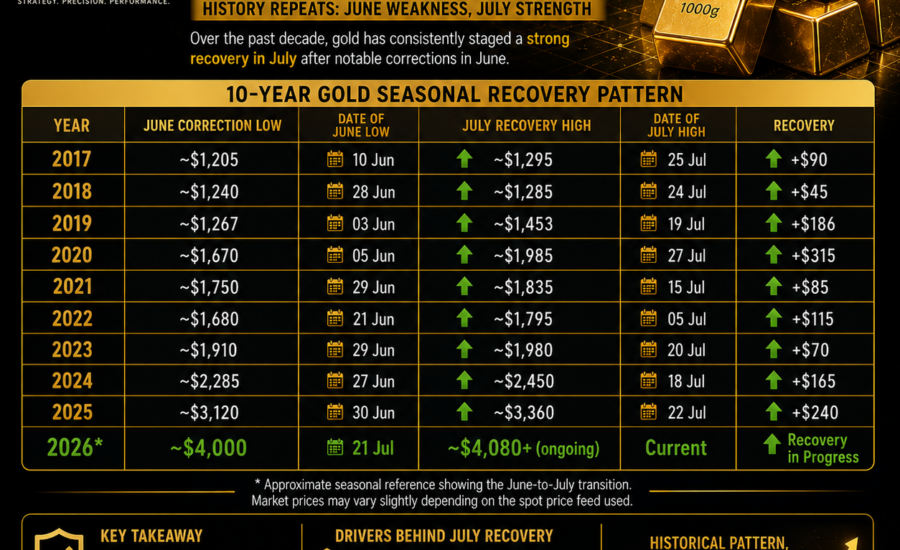
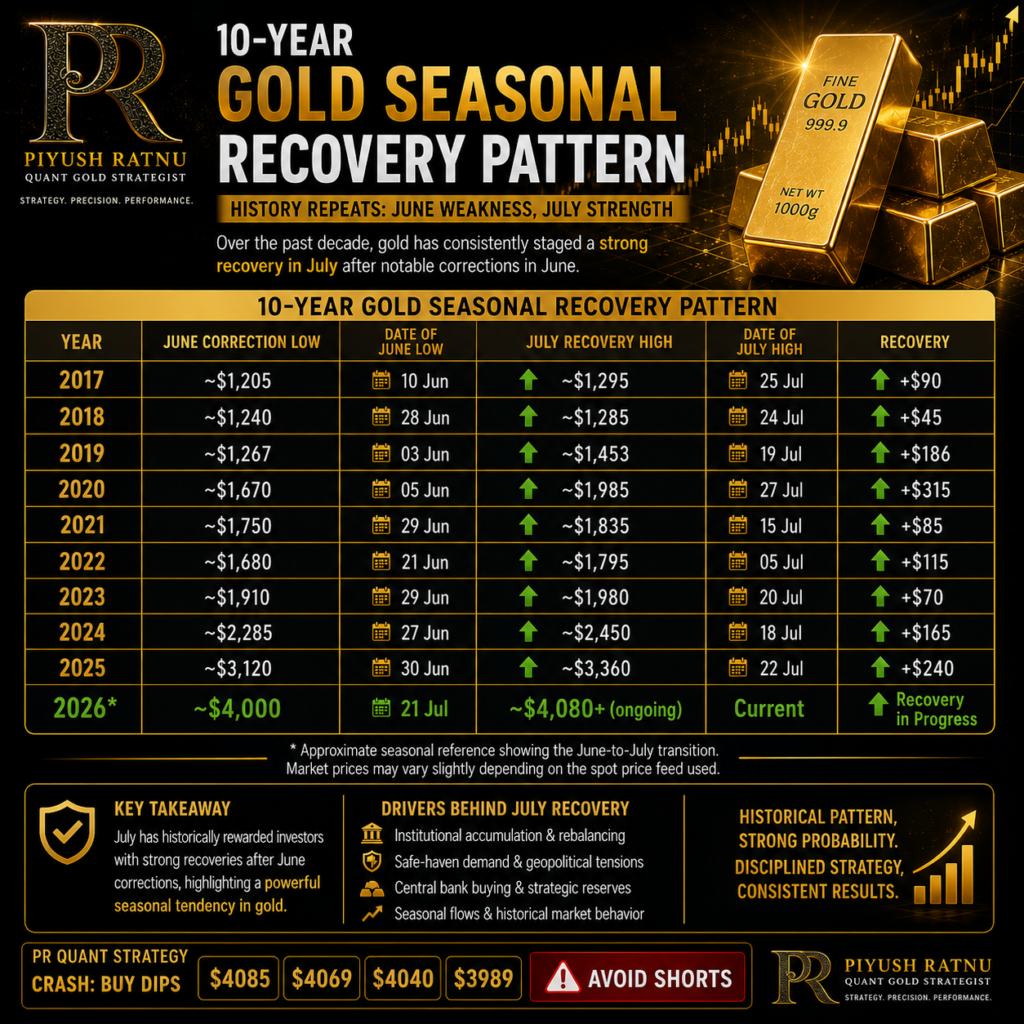
One of the strongest seasonal tendencies in Gold over the past decade has been a significant recovery during July following weakness or corrections in June. Institutional accumulation, portfolio rebalancing, central bank buying, and renewed safe-haven demand have repeatedly contributed to this pattern.
10-Year Gold Seasonal Recovery Pattern
| Year | June Correction Low | Date of June Low | July Recovery High | Date of July High | Recovery |
|---|---|---|---|---|---|
| 2017 | ~$1,205 | 10 Jun 2017 | ~$1,295 | 25 Jul 2017 | +$90 |
| 2018 | ~$1,240 | 28 Jun 2018 | ~$1,285 | 24 Jul 2018 | +$45 |
| 2019 | ~$1,267 | 03 Jun 2019 | ~$1,453 | 19 Jul 2019 | +$186 |
| 2020 | ~$1,670 | 05 Jun 2020 | ~$1,985 | 27 Jul 2020 | +$315 |
| 2021 | ~$1,750 | 29 Jun 2021 | ~$1,835 | 15 Jul 2021 | +$85 |
| 2022 | ~$1,680 | 21 Jun 2022 | ~$1,795 | 05 Jul 2022 | +$115 |
| 2023 | ~$1,910 | 29 Jun 2023 | ~$1,980 | 20 Jul 2023 | +$70 |
| 2024 | ~$2,285 | 27 Jun 2024 | ~$2,450 | 18 Jul 2024 | +$165 |
| 2025 | ~$3,120 | 30 Jun 2025 | ~$3,360 | 22 Jul 2025 | +$240 |
| 2026 | ~$4,000 | 20 Jul 2026 | $4,128 | 22 Jul 2026 | +$128 (+3.20%) |
Approximate seasonal reference showing the June-to-July transition. Market prices may vary slightly depending on the spot price feed used.

Institutional Perspective
The combination of escalating geopolitical tensions, continued central bank interest in Gold, resilient safe-haven demand, and historically favorable July seasonality continues to support a constructive medium-term outlook. While expectations for higher US interest rates and a stronger US Dollar may periodically create volatility, they have so far failed to reverse the broader recovery.
A sustained break above $4,100 would strengthen the probability of additional upside, particularly if geopolitical risks remain elevated and inflation expectations continue to rise alongside energy prices.
PR Quant Strategy
Crash: BUY DIPS
$4085 • $4069 • $4040 • $3989
AVOID SHORTS
Educational market analysis based on historical seasonality, macroeconomic developments, geopolitical correlations, and probability-based quantitative observations. Past performance does not guarantee future results.
The latest recovery once again reinforces the recurring seasonal pattern observed over the past decade. Following a sharp June correction, Gold rebounded from approximately $4,000 on 20 July 2026 to $4,128 on 21 July 2026, delivering a $128 (3.20%) advance within one trading day. This aligns with the historical tendency for July to outperform after June weakness, supported by institutional accumulation, seasonal flows, and heightened geopolitical safe-haven demand. While historical performance does not guarantee future results, the consistency of this pattern over the past ten years strengthens the probability of continued July recovery following significant June declines.