How I Project XAU/USD Price Zones Before NFP Data: My Three-Year Research Record
By Piyush Ratnu | Quant Gold Strategist
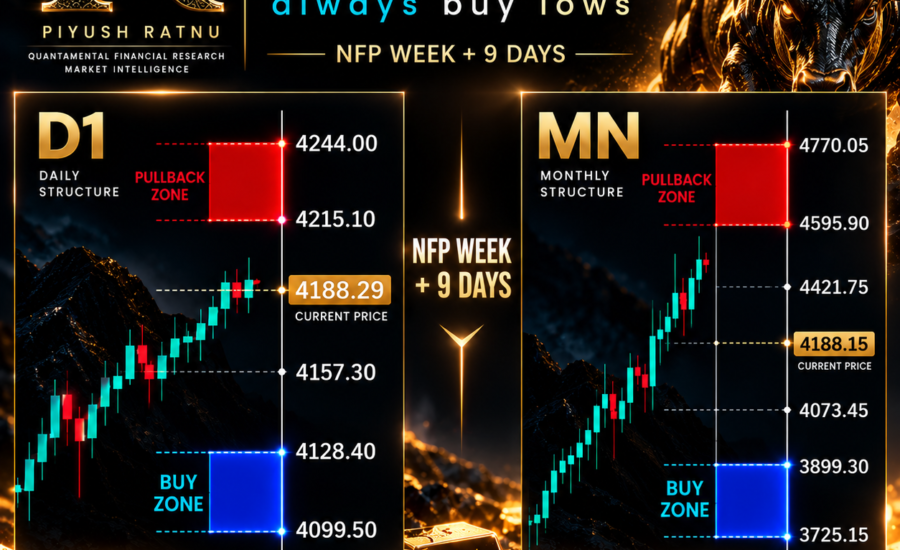
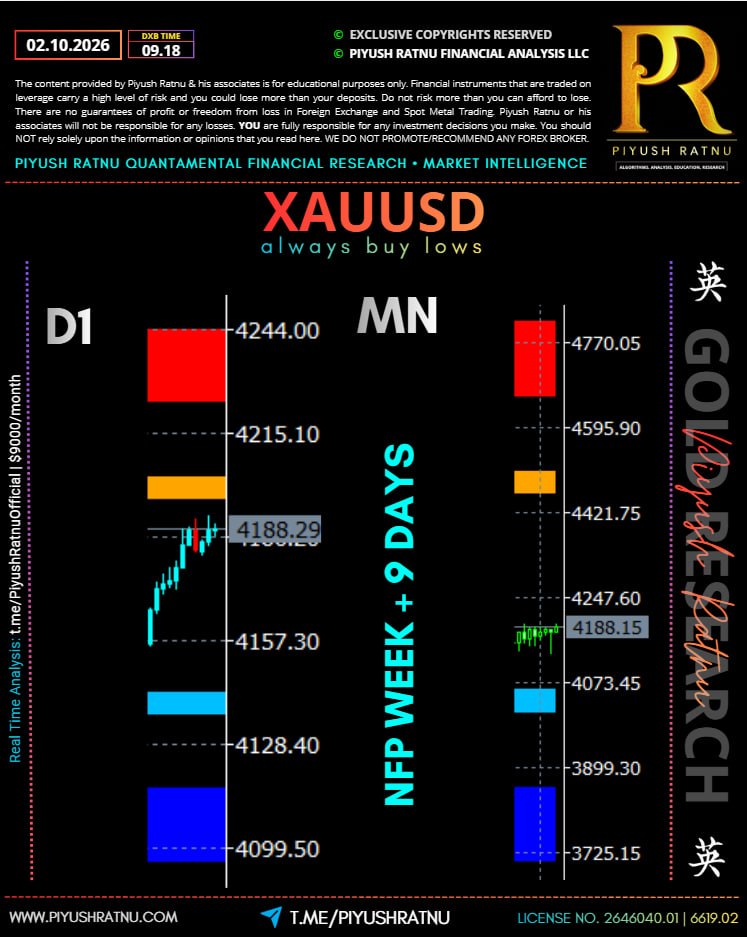
For me, trading XAU/USD on Nonfarm Payrolls day is not about predicting whether the NFP number will be strong or weak. My objective is different: I attempt to identify the price zones Gold is likely to interact with before the NFP data is published.
Over the last three years, I have documented multiple NFP-day XAU/USD projections through my research articles and market updates. Several of these projected zones were subsequently reached by Gold. I believe the value of this work lies not merely in identifying direction, but in mapping important prices before the event creates volatility.
My process combines macroeconomics, intermarket correlations, liquidity, quantitative price mapping, higher-timeframe structure and disciplined risk management.
 I Do Not Trade the NFP Headline Alone
One of the biggest mistakes I see traders making is treating NFP as a simple equation:
Strong NFP = Gold down
Weak NFP = Gold up
Financial markets are considerably more complicated.
When the employment report is released, I study the entire macroeconomic transmission mechanism:
NFP → Fed Expectations → Treasury Yields → DXY → USD/JPY → XAU/USD
I also monitor unemployment, average hourly earnings, revisions to previous payroll numbers and how Treasury yields react to the complete employment report.
Ultimately, the market’s interpretation of the data matters more than the headline itself.
That is why I prefer to map the important XAU/USD prices beforehand and then allow the market to determine which scenario becomes active.
June 2024: Approximately $2,385 to $2,288
One of my important documented NFP examples came in June 2024.
Before the June 7 NFP volatility, my research identified the possibility of a substantial decline in Gold from approximately the $2,369–$2,385 region toward $2,288.
Gold subsequently declined from around $2,385/$2,388 toward the $2,288 region, producing approximately a $100 movement.
I subsequently documented the projection and outcome in my research.
June 2024 — $100 XAU/USD NFP crash projection
For me, the important element was not explaining why Gold crashed after it happened. The objective was to have the important price region identified before the NFP volatility developed.
February 2025: $2,929
My published research record provides another example from February 2025.
My research timeline records an NFP Day XAU/USD Price Projection on February 7, 2025. The subsequent record identifies $2,929 as achieved, noting that the level had been projected during the NFP analysis.
Piyush Ratnu — Gold research track record
This illustrates an important part of my methodology. I am not necessarily looking for the entire projected movement to happen within the first one-minute NFP candle. I am interested in identifying important event-driven price zones and then monitoring how price discovery develops.
April 2025: $2,969
The same research chronology records another NFP-related example from April 4, 2025, when the $2,969 XAU/USD level was identified and subsequently recorded as achieved.
These examples are important to my research because they provide a historical record against which future projections can be evaluated.
A forecast without a timestamp is simply a market opinion.
A forecast published before an event can be measured.
That difference is fundamental to how I want my XAU/USD research to be judged.
June 2026: $4,269 and $4,242
As Gold moved into a completely different nominal price environment during 2026, my methodology continued to focus on predefined clusters rather than emotional reactions to price.
My January–June 2026 accuracy review records $4,269 and $4,242 among the downside zones associated with the June NFP period and documents these levels as subsequently achieved.
January–June 2026 XAU/USD accuracy review
The significance for me is not simply that a particular number was touched. It is whether a level identified through my framework can remain relevant when substantial event-driven volatility arrives.
September 2026: $4,404 Before NFP
The September 2026 NFP provides one of my clearest recent examples.
At approximately 16:18 Dubai time, before the scheduled 16:30 employment release, I published the following XAU/USD scenario:
$4,404 / $4,343 OR $4,545 / $4,585
The purpose was deliberate. I wanted both sides of the potential NFP reaction mapped before the data arrived rather than attempting to invent a target after seeing the result.
Following the release, $4,404 was subsequently reached, and I documented the projection and outcome in my NFP case study.
September 2026 — $4,404 NFP case study
This is precisely how I prefer to approach high-impact economic events: prepare first, react second.
Why I Wait Before Trading NFP
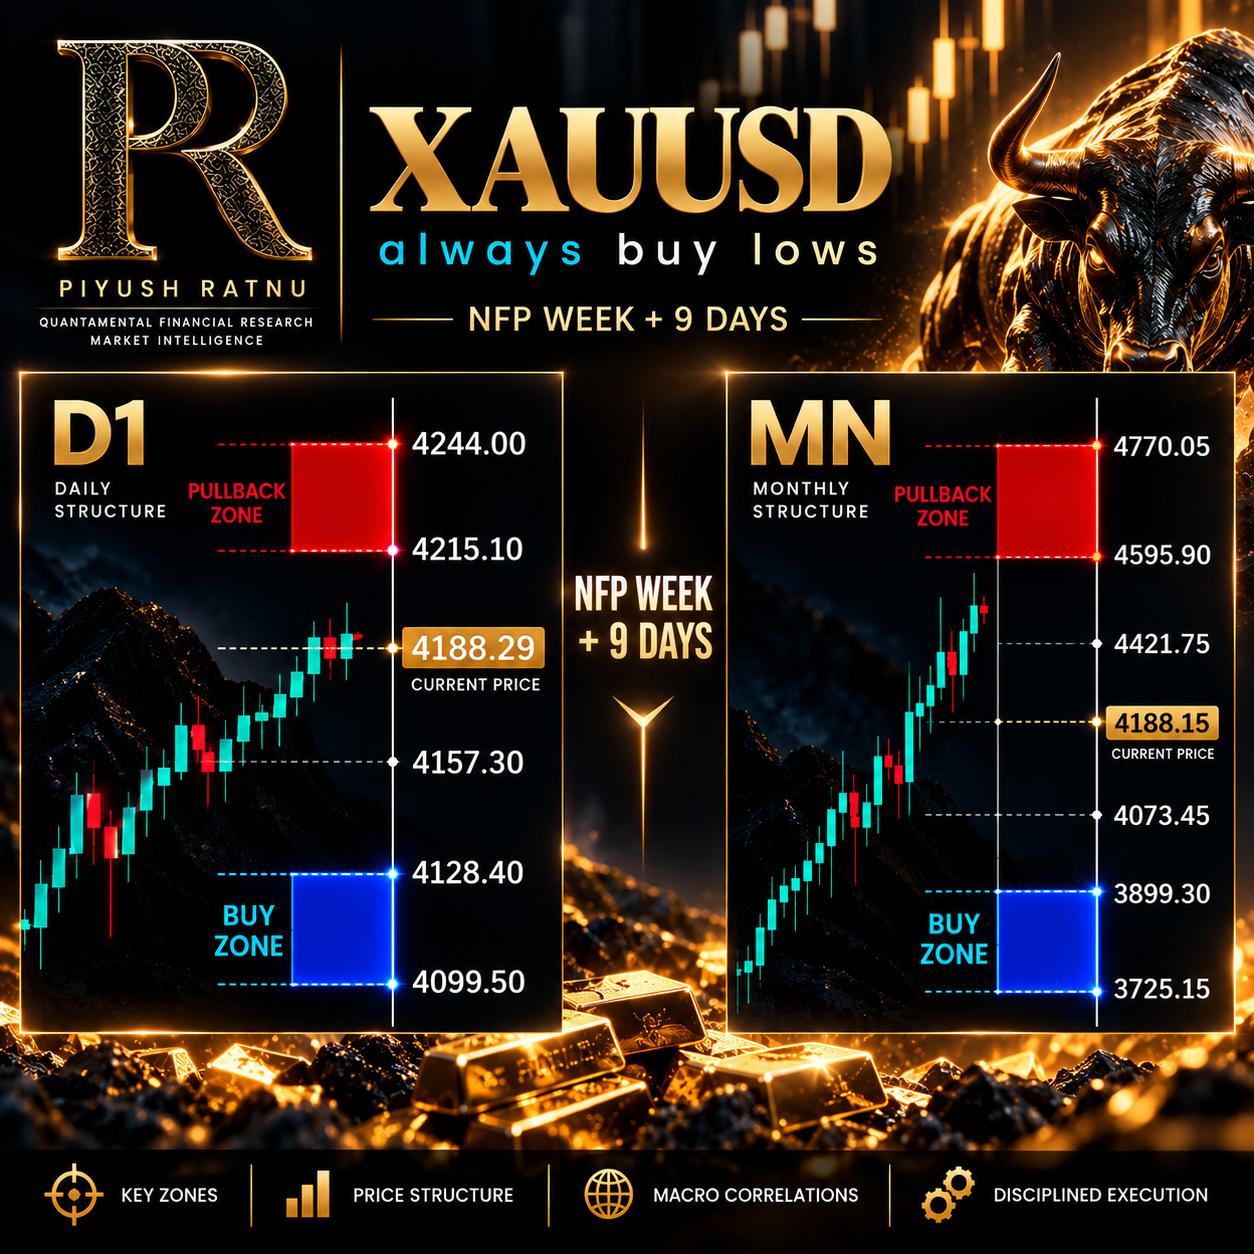
I generally do not want to chase the first NFP candle.
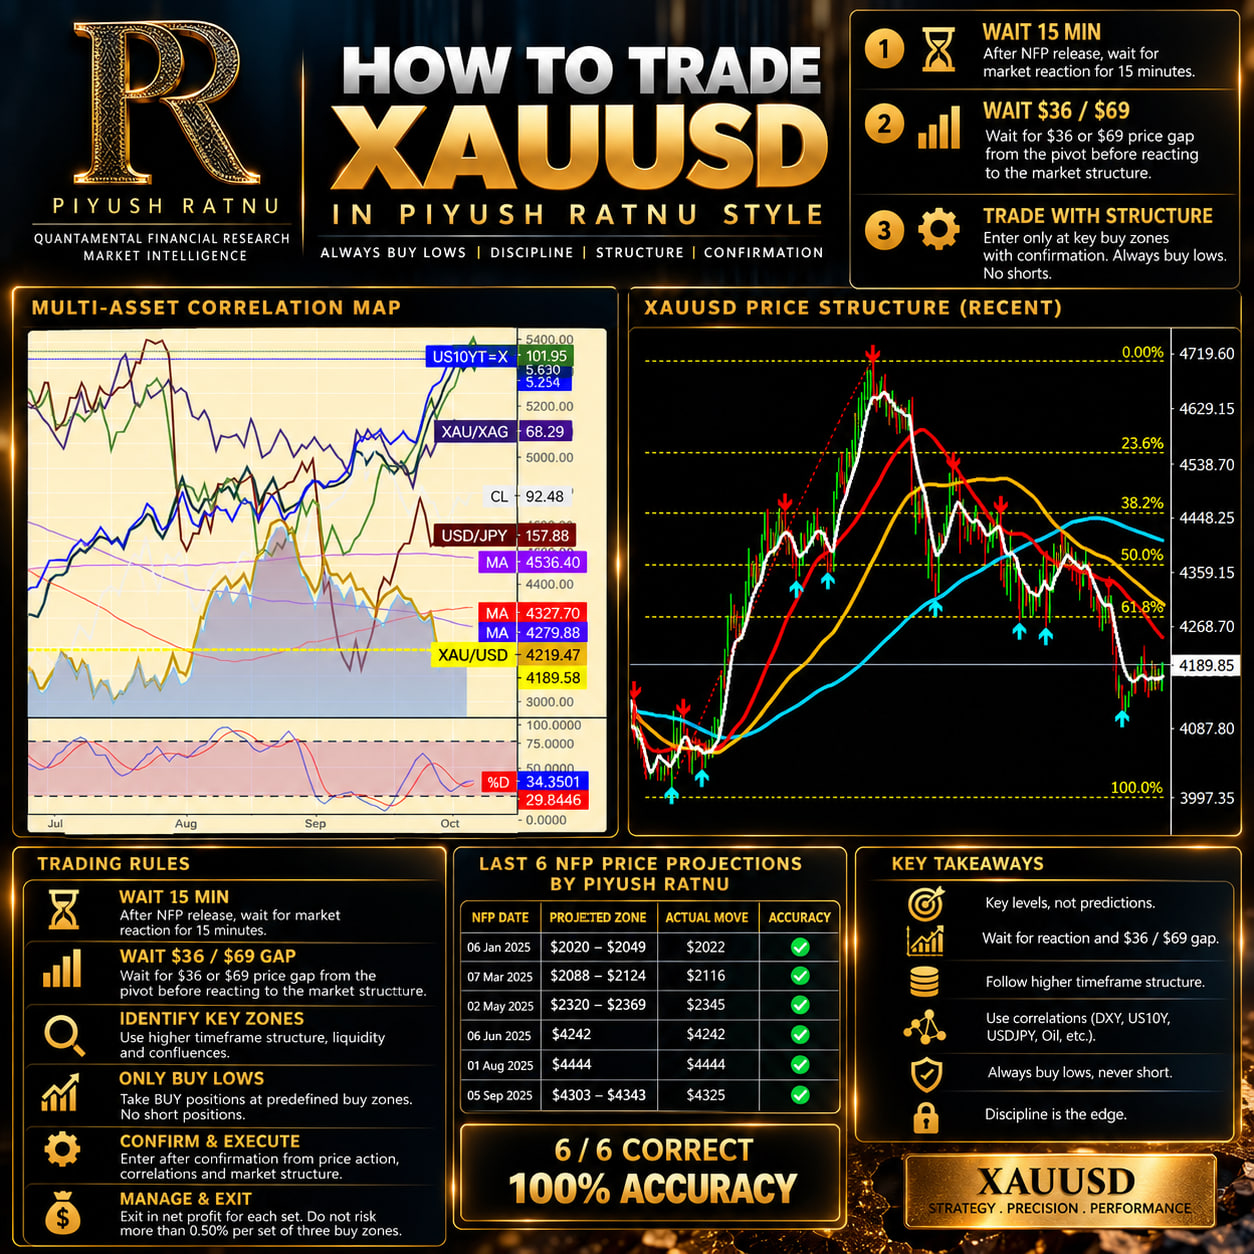
My framework is to allow approximately 15 minutes for the initial market reaction before making a fresh assessment. During that period, I observe liquidity, Treasury yields, DXY, USD/JPY and the structure developing in Gold.
I also monitor approximately $36/$69 of price displacement from my relevant pivot before reacting to the evolving market structure.
These distances are not promises that Gold must reverse.
They are part of my quantitative framework for avoiding emotional entries immediately after an economic shock.
My sequence is:
NFP Release → Wait 15 Minutes → $36/$69 Price Gap → Correlations → Market Structure → BUY Zone → Confirmation → Execution
 Correlations Are the Foundation of My Analysis
I do not believe XAU/USD should be analysed independently.
I continuously study US10Y, US30Y, DXY, USD/JPY, crude oil, inflation expectations, monetary-policy expectations and other cross-market relationships.
For example, one common transmission mechanism is:
Inflation Pressure ↑ → Fed Expectations ↑ → Treasury Yields ↑ → DXY ↑ → Pressure on Gold
But correlations are dynamic.
There are periods when Gold and the Dollar rise together. There are periods when geopolitical risk overwhelms the normal yield relationship. There are also sessions when Treasury yields move aggressively but Gold refuses to break an important support zone.
That divergence itself can provide information.
This is why I never want a single correlation to dictate my trade.
I want confluence.
My Philosophy: Always Buy Lows
My trading philosophy remains:
ALWAYS BUY LOWS.
But this statement is frequently misunderstood.
It does not mean buying every falling candle.
I want to buy at a price where my macroeconomic framework, quantitative levels, higher-timeframe structure, liquidity analysis and correlations indicate that the risk/reward has become more attractive.
I would rather wait for Gold to reach my predetermined BUY zone than chase price after a $50–$100 rally.
A correct market view entered at the wrong price can still create unnecessary risk.
The entry matters.
Risk Management Comes Before Accuracy
I am proud of the NFP projections that have subsequently interacted with my published levels, but I do not believe any analyst should assume that historical accuracy guarantees the next forecast.
Markets change.
Correlations change.
Volatility changes.
Even a highly accurate methodology will eventually produce projections that do not behave as expected.
That is why my priority is always capital preservation.
I prefer predefined exposure, controlled position sizing and a maximum-risk framework rather than continuously adding positions simply because price has moved lower.
My philosophy can therefore be summarized as:
Right Direction + Wrong Price = Unnecessary Risk
Right Zone + Confirmation + Controlled Exposure = Better Execution
Three Years of Building an Evidence-Based Process
From approximately $2,385 → $2,288 in June 2024, through the $2,929 and $2,969 regions in 2025, to $4,269/$4,242 and $4,404 in 2026, my objective has remained consistent: identify meaningful XAU/USD price zones before major economic events and document the analysis so it can later be evaluated against what actually happened.
———————————————————————————–
June 2026 — $4,269 → $4,242
One of the clearest examples in my recent NFP research was June.
My downside map identified $4,269 followed by $4,242. My published January–June review subsequently recorded both price levels as achieved.
My January–June 2026 XAU/USD Accuracy Review
For me, this illustrates why I prefer preparing price zones before high-impact data rather than chasing Gold after the initial NFP candle.
September 2026 — $4,404 Achieved
September provides another important example.
At approximately 16:18 Dubai time, before the scheduled 16:30 NFP release, my published XAU/USD scenario was:
$4,404 / $4,343 OR $4,545 / $4,585
Following the NFP release, $4,404 was subsequently achieved.
My September 2026 NFP $4,404 Case Study
This is exactly how I prefer to approach NFP: map both sides before the data and let market structure determine which side becomes active.
My NFP Trading Philosophy
I generally prefer to wait approximately 15 minutes after NFP instead of chasing the first reaction. I then observe whether Gold has produced approximately a $36/$69 displacement from my relevant pivot, while simultaneously monitoring DXY, US Treasury yields, USD/JPY and the evolving XAU/USD structure.
My process is:
NFP → Wait 15 Minutes → $36/$69 Price Gap → Correlations → Price Structure → BUY Zone → Confirmation → Execution
My philosophy remains Always Buy Lows, but buying lows does not mean buying blindly. The right price, controlled exposure and confirmation are more important to me than trying to participate in every NFP movement.
— Piyush Ratnu
Quant Gold Strategist
Strategy. Precision. Performance.

2 Replies to “How I Project XAU/USD Price Zones Before NFP Data: My Three-Year Research Record”
[…] Ratnu X post ·Instagram evidence ·NFP research record ·Telegram post […]
[…] How I Project XAU/USD Price Zones Before NFP Data — Three-Year Research Record […]