
Piyush Ratnu Accuracy Review: XAUUSD Price Projection Before and After NFP — October 2026
A timestamped review of the $4,215–$4,244 pre-NFP Pullback Zone, $4,224 achievement, $4,169/$4,141/$4,124 buying zones and subsequent $4,150–$4,169 retracements
The October 2026 Nonfarm Payrolls event provides a particularly useful case study for evaluating Piyush Ratnu’s approach to XAU/USD price projection. Instead of explaining Gold’s movement after the economic release, the methodology focused on mapping important price zones before NFP, documenting them with timestamps, and then comparing those projections with the price action that followed.
 The sequence became notable because it captured several different phases of the event: the $4,215–$4,244 Pullback Zone before NFP, the subsequent achievement of $4,224, the sharp reversal despite weaker employment data, three lower buying zones at $4,169/$4,141/$4,124, and subsequent retracement projections toward $4,150 and $4,169.
The result was not simply a directional NFP call. It became a broader demonstration of price-zone mapping before, during and after one of the most volatile macroeconomic events for Gold.
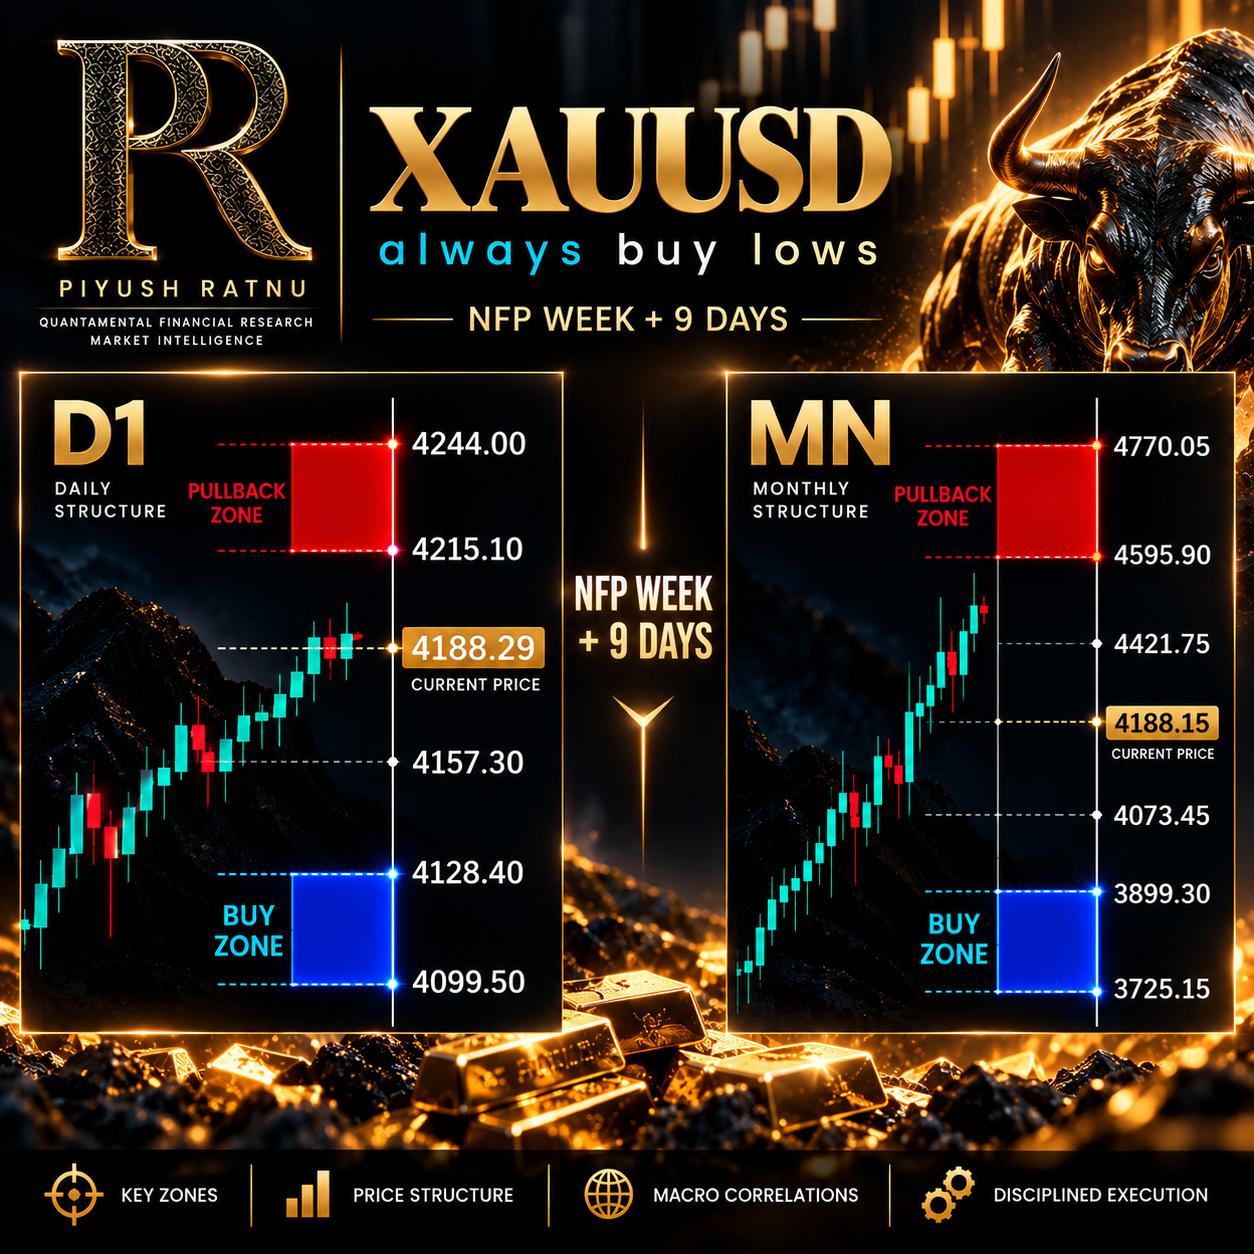
October 1–2: Mapping XAU/USD Before NFP
The preparation began before the October 2 employment report.
The framework used for the event combined several variables rather than relying exclusively on the headline payroll number:
Macroeconomics → NFP → Unemployment → Wages → Fed Expectations → US Treasury Yields → DXY → USD/JPY → Liquidity → Higher-Timeframe Structure → Quantitative Price Mapping
China’s Golden Week was another factor considered because reduced Chinese market participation could affect liquidity conditions around an already significant U.S. macroeconomic event.
Within this framework, the principal higher-timeframe upside region identified ahead of NFP was:
D1 PULLBACK ZONE: $4,215–$4,244
The significance of this zone lies not simply in where it was located, but when it was published.
October 2, 09:39 — $4,224 Highlighted Before NFP
On October 2, the $4,224 XAU/USD price zone was highlighted at approximately 09:39 Dubai time, according to the timestamped Telegram publication supplied for this review.
That was almost seven hours before the scheduled 16:30 Dubai-time NFP release.
09:39 — Pre-NFP $4,224 projection proof
A more detailed analysis was subsequently published at approximately 11:03 Dubai time, still several hours before the employment report.
11:03 — Pre-NFP analysis proof
The methodology and broader three-year NFP research record were also discussed in a dedicated article.
How I Project XAU/USD Price Zones Before NFP Data — Three-Year Research Record
This chronology is fundamental to an accuracy review. A level identified after Gold has already traded there is an observation. A level documented before the event can be evaluated as a forecast.
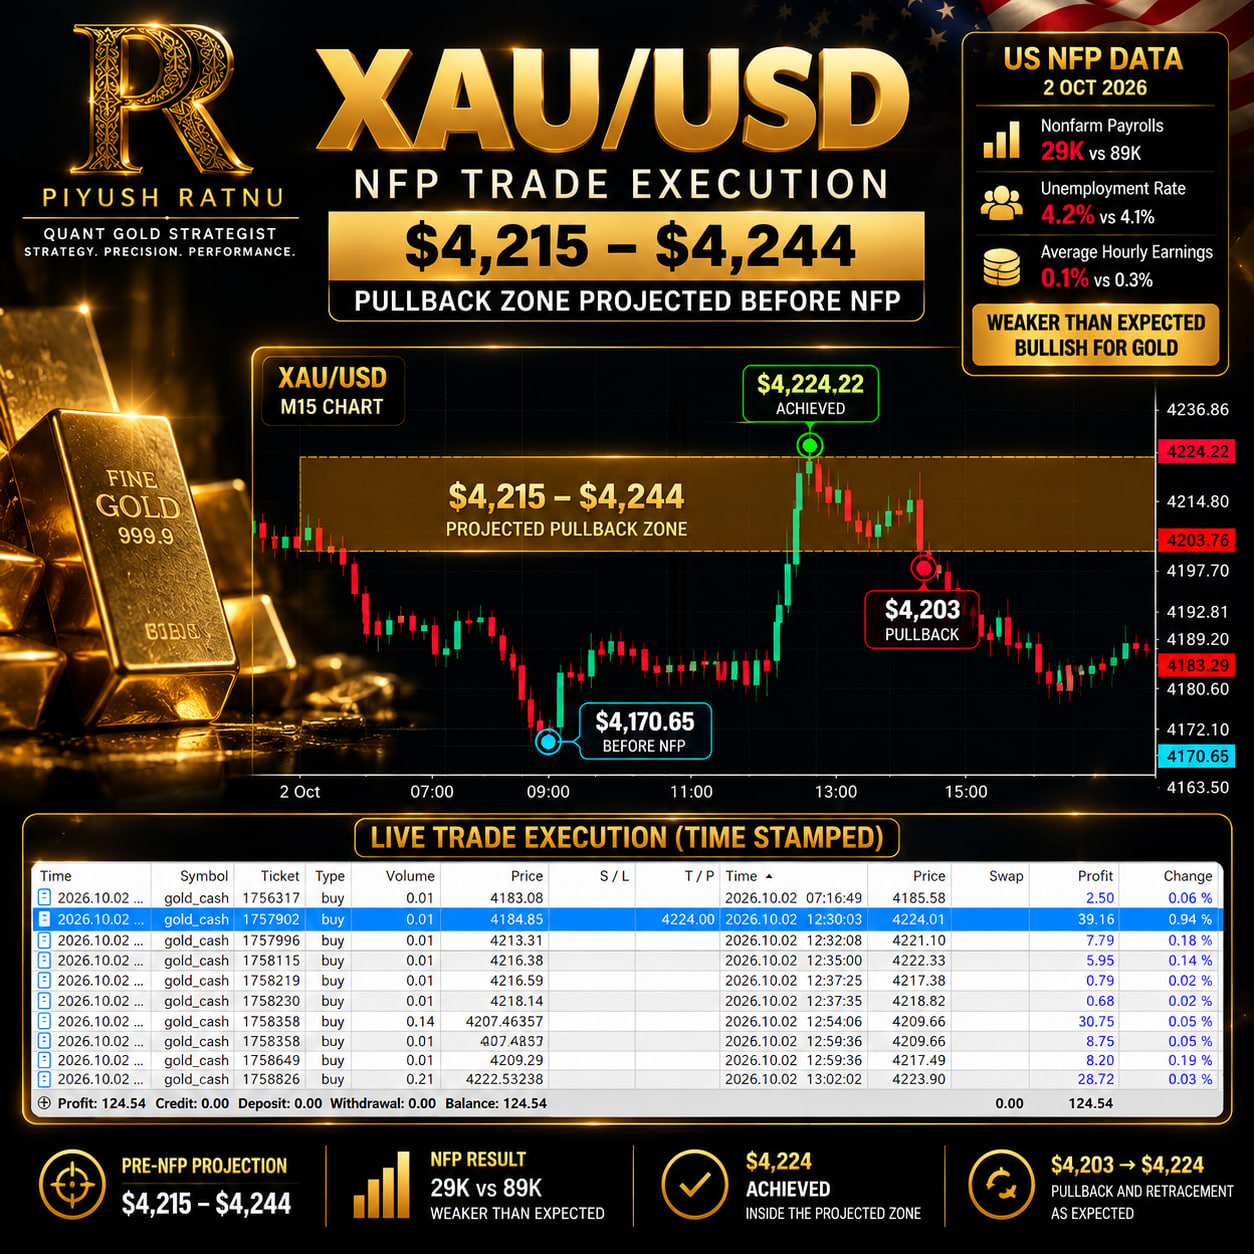
16:30 NFP: Weak Employment Data and $4,224 Achieved
When the employment report arrived, the headline figures were considerably softer than market expectations.
The October release showed Nonfarm Payrolls at +29K versus +89K expected. The unemployment rate was 4.2% versus 4.1% expected, Average Hourly Earnings increased only 0.1% month-on-month versus 0.3% expected, while Private Nonfarm Payrolls printed 46K versus 85K expected.
In conventional macroeconomic terms, the combination pointed toward a softer labor market:
Weaker Employment + Softer Wages → Lower Rate Expectations → Potential Yield/DXY Pressure → Gold Support
Gold initially responded accordingly.
XAU/USD advanced into the previously identified $4,215–$4,244 Pullback Zone, with $4,224 achieved following the NFP release.
$4,224 achieved — Telegram confirmation
A timestamped screenshot of the associated trading activity was also published.
Trade screenshot — Timestamped proof
16.45 BUYSIDE LIQUIDITY PROJECTED
16.55 AFTER NFP | PR BUYING ZONES
The first part of the October sequence could therefore be summarized:
09:39 → $4,224 highlighted
11:03 → Pre-NFP analysis published
16:30 → NFP released
Post-NFP → $4,224 achieved inside $4,215–$4,244
This distinction between projection time and achievement time is central to assessing the call.
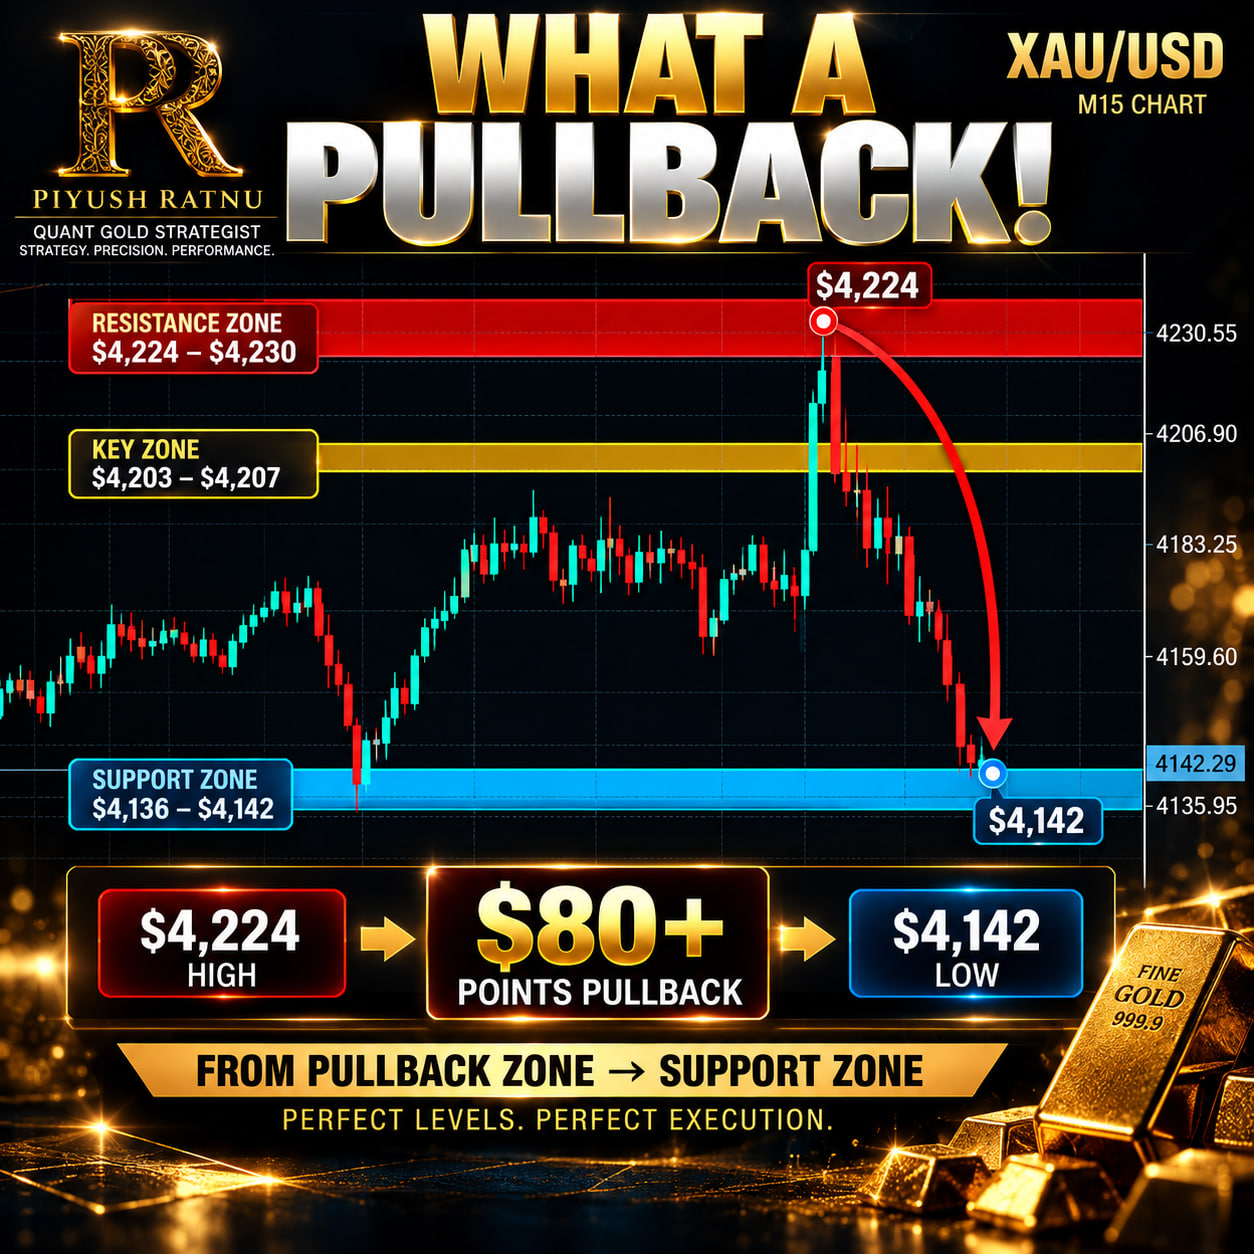 $4,224 Was Not the End of the Analysis
What happened next arguably made the October case more interesting.
Despite the weaker-than-expected employment report, Gold did not continue rising indefinitely.
After reaching the projected upside region, XAU/USD reversed sharply.
This illustrates why interpreting NFP as simply “weak data equals higher Gold” can be inadequate. Economic data provide the catalyst, but subsequent price action can be affected by Treasury yields, DXY, USD/JPY, liquidity positioning, profit-taking, order flow and technical structure.
In other words, a successfully achieved bullish price target does not automatically become a forecast for permanently higher prices.
Once the $4,224 objective had been reached, the analytical focus changed.
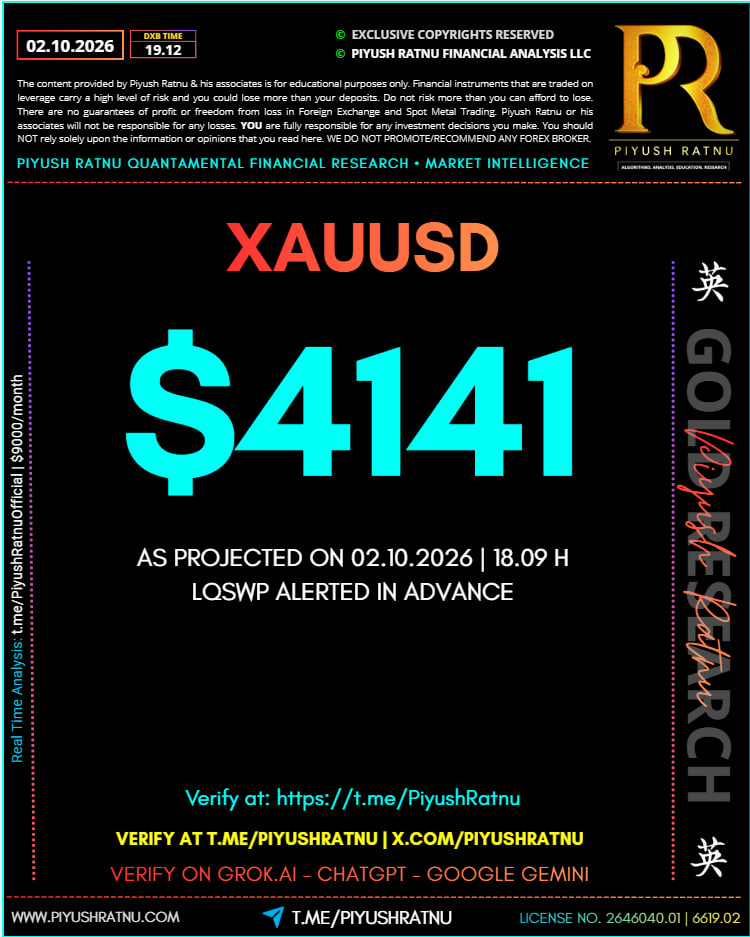
18:09 — “I Will Buy Lows”: $4,169/$4,141/$4,124 Projected
As the post-NFP reversal developed, Piyush Ratnu published a second important component of the October price map.
At approximately 18:09 Dubai time on October 2, the analysis explicitly stated:
“I WILL BUY LOWS”
Three lower XAU/USD buying zones were identified:
BUYING ZONE 1 — $4,169
BUYING ZONE 2 — $4,141
BUYING ZONE 3 — $4,124
The timestamped publication is available here:
18:09 — $4,169/$4,141/$4,124 buying-zone projection
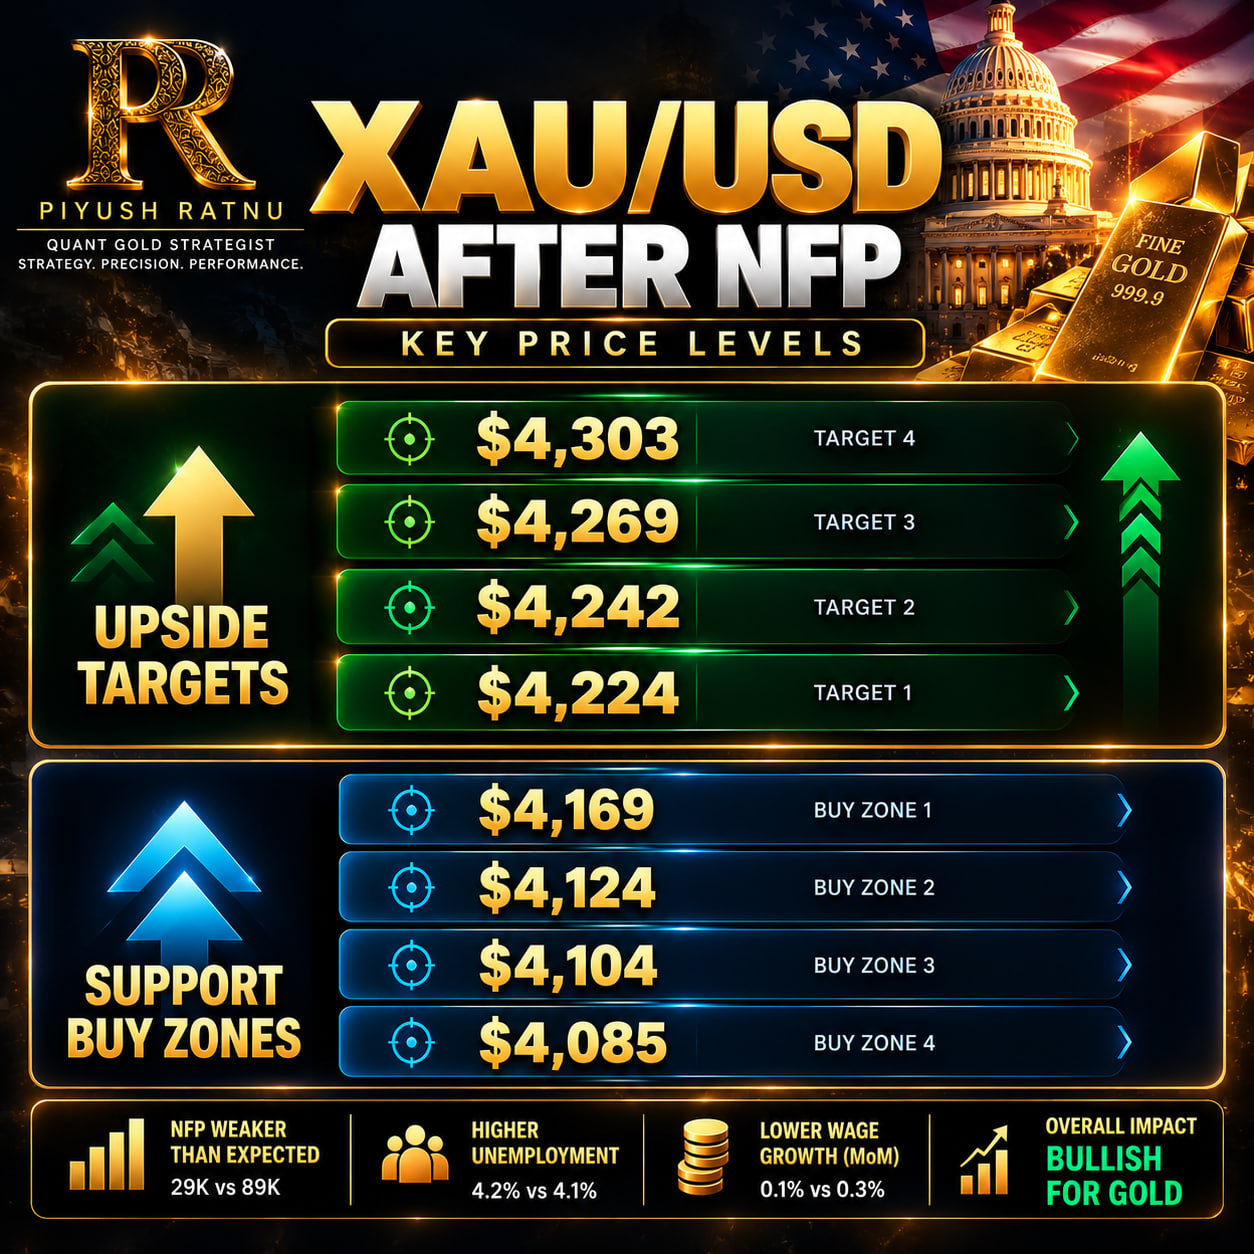
This is an important correction to the event chronology. The lower projection was not simply $4,124. The published map consisted of a three-level buying structure:
$4,169 → $4,141 → $4,124
XAU/USD subsequently continued through those lower areas and ultimately traded around the $4,124 region.
The overall event sequence had therefore developed from:
$4,224 upside objective achieved
into:
$4,169 → $4,141 → $4,124 lower buying structure
The analytical approach had moved from targeting the NFP expansion to identifying areas where the subsequent decline could become increasingly interesting from the BUY side.
20:12 — $4,150 Retracement Projected
After Gold had experienced its substantial post-NFP decline, attention turned to the potential retracement.
At approximately 20:12 Dubai time, a projection was published identifying approximately $4,150 as the expected retracement area, with an anticipated time horizon of around three hours.
20:12 — $4,150 retracement projection proof
The projection was also posted publicly on X.
$4,150 retracement projection on X
According to the timestamped follow-up supplied for this review, $4,150 was achieved approximately three hours and three minutes later.
$4,150 achieved — Telegram confirmation
This adds another dimension to the October analysis.
The sequence was no longer simply:
Forecast an NFP target → target achieved.
It had developed into:
Pre-NFP upside projection → target achieved → reversal mapped → lower buying zones reached → retracement projected → retracement achieved.
October 5: $4,124 Revisited and $4,169 Recovery
The relevance of the October 2 map continued beyond NFP day.
On October 5, 2026, XAU/USD returned to approximately the $4,124 region, revisiting the deepest of the three buying zones identified on October 2.
Gold subsequently recovered to approximately:
$4,169 by 13:30 Dubai time
From $4,124 to $4,169, that represents an approximately $45 recovery.
The October 5 movement is better interpreted as continued interaction with the October 2 price map rather than as a new NFP forecast.
What is particularly interesting is the relationship between the two levels:
$4,124 → $4,169
Both were already components of the three-zone structure published after NFP:
$4,169 / $4,141 / $4,124
Thus, the same predefined price framework remained relevant several days after the original employment release.
The Complete October 2026 NFP Timeline
The full sequence can therefore be reconstructed as follows:
- October 1–2: $4,215–$4,244 identified as the D1 Pullback Zone.
- 02 Oct, 09:39 DXB: $4,224 highlighted before NFP.
- 02 Oct, 11:03 DXB: detailed analysis published before NFP.
- 02 Oct, 16:30 DXB: weaker-than-expected NFP released.
- Post-NFP: $4,224 achieved inside the projected $4,215–$4,244 zone.
- 02 Oct, 18:09 DXB: “I WILL BUY LOWS”; $4,169/$4,141/$4,124 buying zones published.
- Post-NFP decline: Gold subsequently reached approximately $4,124.
- 02 Oct, 20:12 DXB: approximately $4,150 retracement projected within three hours.
- Approximately 3h 03m later: $4,150 achieved.
- 05 Oct: XAU/USD revisited approximately $4,124.
- 05 Oct, 13:30 DXB: Gold recovered to approximately $4,169.
This chronology is more meaningful than reducing the event to a simple “bullish” or “bearish” NFP call.
The market moved aggressively in both directions, while different predefined zones became relevant at different stages.
Last Three NFP Analyses: A Consistent Price-Mapping Approach
The October case can also be viewed alongside Piyush Ratnu’s recent NFP research.
June 2026 NFP
For the June event, Ratnu’s published research identifies $4,269 and $4,242 as relevant downside price zones. The subsequent accuracy review records both levels as achieved.
September 2026 NFP
Ahead of the September NFP release, Ratnu published a two-sided scenario shortly before the data:
$4,404 / $4,343 OR $4,545 / $4,585
Following the employment report, Gold moved lower and $4,404 was reached.
October 2026 NFP
October then produced the pre-event:
$4,215–$4,244 Pullback Zone
followed by:
$4,224 achieved
and subsequently the post-event:
$4,169 / $4,141 / $4,124 buying structure
followed by the projected:
$4,150 retracement
and, on October 5:
$4,124 → $4,169 recovery
The three recent NFP examples can therefore be summarized as:
June: $4,269 / $4,242 → Achieved
September: $4,404 → Achieved
October: $4,215–$4,244 → $4,224 Achieved
Evaluating Piyush Ratnu’s Broader Accuracy Record
Piyush Ratnu has published broader reviews of his XAU/USD forecasts covering multiple macroeconomic events and price projections.
The important distinction is that these are primarily self-published accuracy reviews. They provide useful timestamped evidence and a basis for independent checking, but they should not be described as equivalent to an independently audited institutional forecasting record unless an external audit has actually been performed.
For that reason, the October NFP case is best evaluated through its individual timestamps rather than through a promotional accuracy percentage.
The relevant questions are straightforward:
Was the price level published before the event?
Was the publication timestamped?
Was the target sufficiently specific to be measured?
Did XAU/USD subsequently trade at that level?
For October, the evidence trail supplied for this review allows those questions to be examined directly.
Key Factors Mapped Before and After NFP
Another important aspect of the October research is that the projections were not presented as isolated technical levels.
The analytical framework considered several interconnected variables:
NFP and unemployment — measuring labor-market strength.
Average Hourly Earnings — important for wage-driven inflation expectations.
Federal Reserve expectations — changing as employment and inflation data evolve.
U.S. Treasury yields — one of Gold’s most important macro correlations.
DXY — measuring broad U.S. Dollar strength.
USD/JPY — useful for monitoring Dollar/yield dynamics and risk positioning.
Liquidity conditions — particularly relevant around NFP and during Chinese Golden Week.
Higher-timeframe XAU/USD structure — defining the areas where price could react.
Quantitative price mapping — converting the macro scenario into specific measurable zones.
This produces the broader framework:
MACRO → CORRELATIONS → LIQUIDITY → PRICE STRUCTURE → PRICE ZONES → CONFIRMATION → EXECUTION
The October event demonstrated why all of these components matter.
Weak NFP initially supported Gold and helped propel XAU/USD into the projected $4,215–$4,244 area. Yet the subsequent collapse demonstrated that the first macro reaction was not permanent.
The market then interacted with the separately identified $4,169/$4,141/$4,124 buying structure, before retracing.
Conclusion: Projection Before the Event, Verification After the Event
The October 2026 NFP episode provides a particularly detailed example of Piyush Ratnu’s approach to XAU/USD research because it can be divided into several measurable stages.
BEFORE NFP
$4,215–$4,244 projected
AFTER NFP
$4,224 achieved
POST-NFP BUYING ZONES
$4,169 / $4,141 / $4,124 projected
DECLINE
$4,124 reached
RETRACEMENT
$4,150 projected → achieved
05 OCTOBER
$4,124 revisited → $4,169 recovery by 13:30 DXB
Rather than relying solely on retrospective explanations, the strongest aspect of this record is the availability of timestamped projections published before the corresponding price movements.
That remains the most useful standard for evaluating forecasting research:
What was projected?
When was it published?
What happened afterward?
For Piyush Ratnu’s October 2026 NFP analysis, the documented sequence provides a detailed case study of pre-event price mapping, post-event adaptation and subsequent retracement analysis.
Projection before the event. Confirmation after the event. Risk management throughout.
READ SUMMARY
— Piyush Ratnu | Quant Gold Strategist
Strategy. Precision. Performance.
Disclaimer: This article reviews historical forecasts and user-supplied/timestamped publication records for research purposes. Self-published forecast records should be distinguished from independently audited performance. Historical target achievement does not guarantee future forecasting or trading results.