August NFP vs XAU/USD — Exact 7-Trading-Day Event Study, 2020–2025
Based on XAUUSD_D1 (1)(1).csv daily-price file and the event window as 3 normal trading days before NFP + NFP Friday + 3 normal trading days after NFP. The underlying OHLC observations around each release are visible in data for 2020–2024 and 2025. Access XAUUSD Price Data File D1 2009-2026 here.
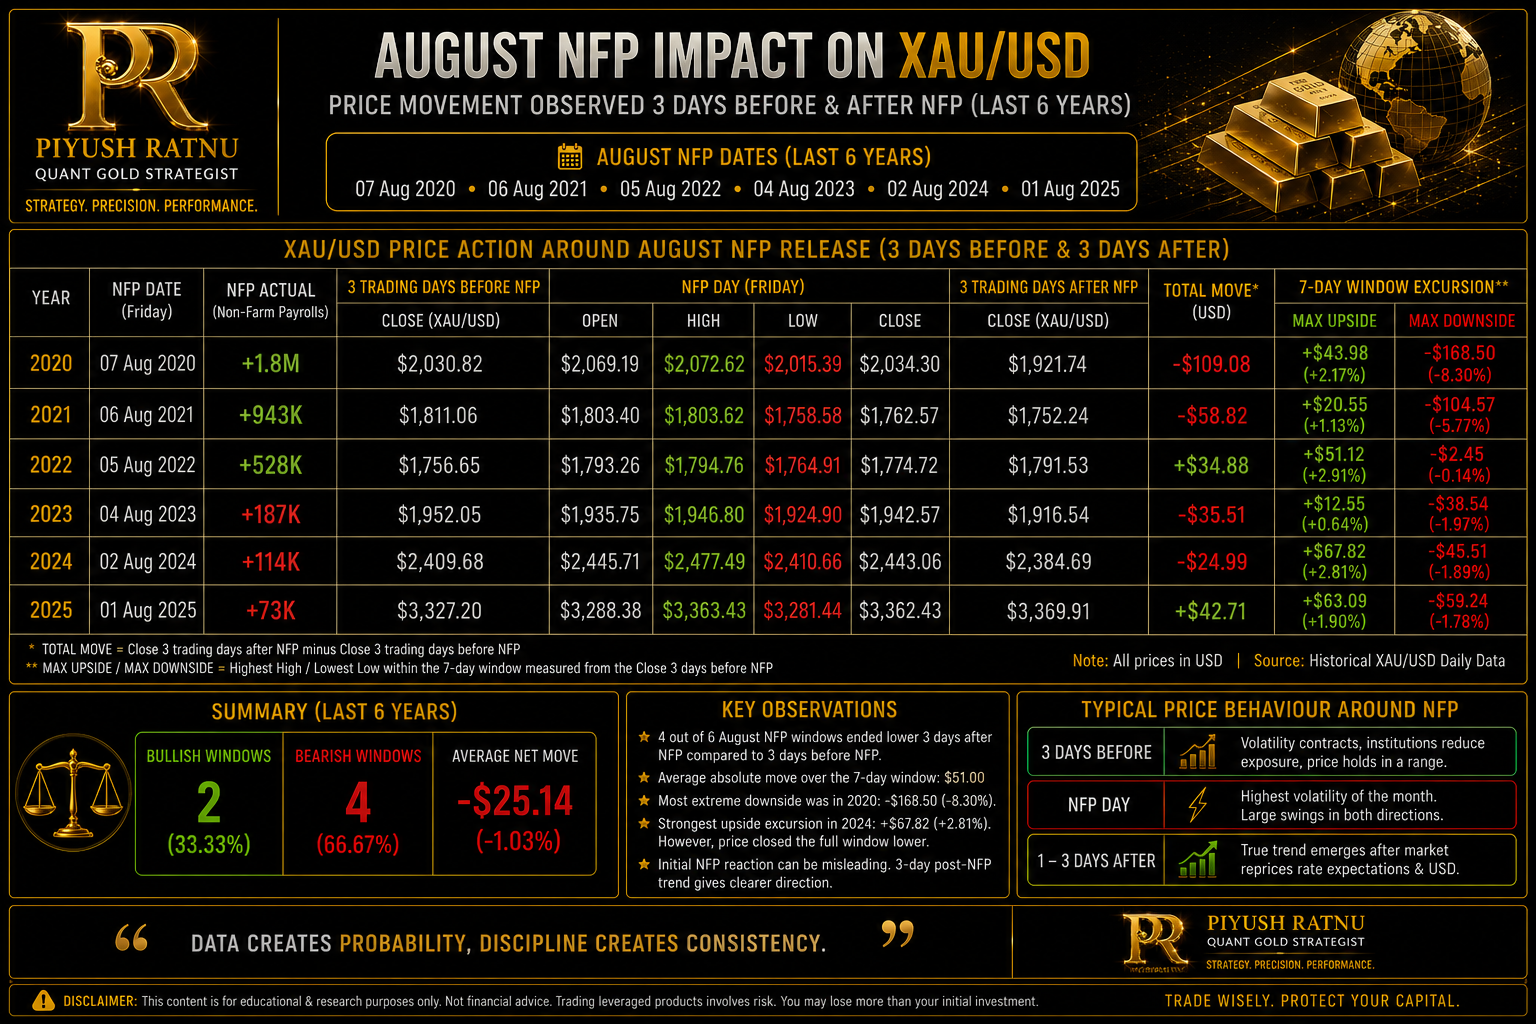
For reference, the August releases occurred on 7 Aug 2020, 6 Aug 2021, 5 Aug 2022, 4 Aug 2023, 2 Aug 2024, and 1 Aug 2025. BLS reported approximately +1.8M, +943K, +528K, +187K, +114K, and +73K payroll gains respectively.
| Year | NFP Date | NFP Actual | Close 3 Days Before | NFP Open | NFP High | NFP Low | NFP Close | Close 3 Days After | Total Move* | % Move | Max Upside Excursion** | Max Downside Excursion** |
|---|---|---|---|---|---|---|---|---|---|---|---|---|
| 2020 | 07 Aug | +1.8M | $2,030.82 | $2,069.19 | $2,072.62 | $2,015.39 | $2,034.30 | $1,921.74 | -$109.08 | -5.37% | +$43.98 / +2.17% | -$168.50 / -8.30% |
| 2021 | 06 Aug | +943K | $1,811.06 | $1,803.40 | $1,803.62 | $1,758.58 | $1,762.57 | $1,752.24 | -$58.82 | -3.25% | +$20.55 / +1.13% | -$104.57 / -5.77% |
| 2022 | 05 Aug | +528K | $1,756.65 | $1,793.26 | $1,794.76 | $1,764.91 | $1,774.72 | $1,791.53 | +$34.88 | +1.99% | +$51.12 / +2.91% | -$2.45 / -0.14% |
| 2023 | 04 Aug | +187K | $1,952.05 | $1,935.75 | $1,946.80 | $1,924.90 | $1,942.57 | $1,916.54 | -$35.51 | -1.82% | +$12.55 / +0.64% | -$38.54 / -1.97% |
| 2024 | 02 Aug | +114K | $2,409.68 | $2,445.71 | $2,477.49 | $2,410.66 | $2,443.06 | $2,384.69 | -$24.99 | -1.04% | +$67.82 / +2.81% | -$45.51 / -1.89% |
| 2025 | 01 Aug | +73K | $3,327.20 | $3,288.38 | $3,363.43 | $3,281.44 | $3,362.43 | $3,369.91 | +$42.71 | +1.28% | +$63.09 / +1.90% | -$59.24 / -1.78% |
* Total Move = close three trading days after NFP − close three trading days before NFP.
**Excursions are measured from the close three trading days before NFP to the highest high / lowest low anywhere in the seven-session window.**
What the six-year sample shows
- 4 of 6 August NFP windows ended lower three trading days after the report versus three days before: 2020, 2021, 2023 and 2024.
- Only 2022 and 2025 produced a positive full-window result.
- Average absolute pre-to-post move was approximately $51.00, showing that the wider NFP event window can be substantially larger than the NFP-day candle alone.
- The sample had an average net result of approximately -$25.14, giving August NFP windows a modest historical downside skew.
- The most extreme downside episode was 2020: -$168.50 (-8.30%) from the pre-NFP baseline.
- The strongest upside excursion was 2024: +$67.82 (+2.81%), but importantly Gold subsequently reversed and finished the full window -$24.99 (-1.04%).
 The important pattern
The data shows why judging NFP solely from the initial candle can be misleading. 2024 is the clearest example: Gold reached $2,477.49 during the seven-session window after entering it from a $2,409.68 baseline, yet three trading days after NFP it was down at $2,384.69. Conversely, 2025 generated a large bullish NFP-day candle and maintained enough follow-through to finish the complete event window positive.
So for the 2020–2025 August sample, the historical tendency was approximately 67% negative / 33% positive when measuring from three trading days before NFP to three trading days after. This is a six-event observation, not a predictive probability, and the exact XAU/USD figures can vary slightly across brokers because of server timezone and daily-candle construction.
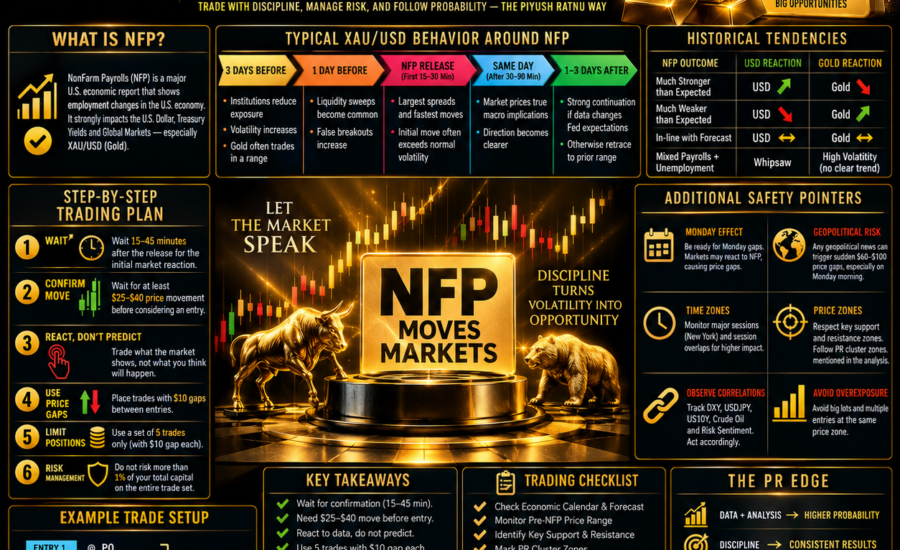
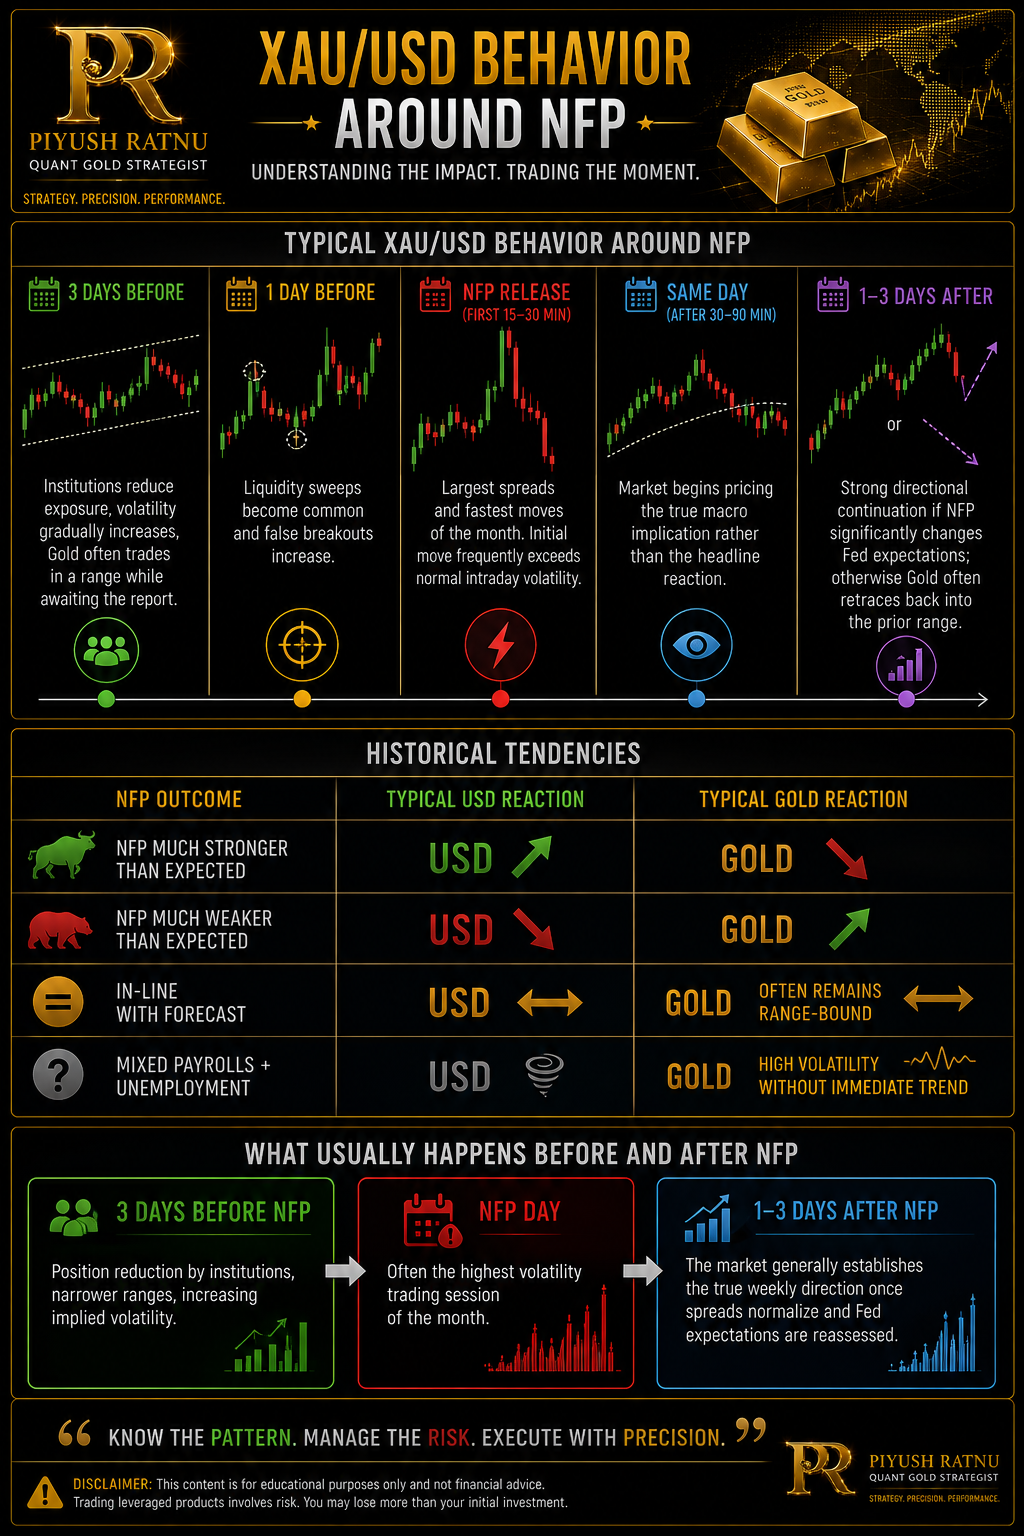
Typical XAU/USD Behavior Around NFP
| Time Window | Typical Behaviour |
|---|---|
| 3 Days Before | Institutions reduce exposure, volatility gradually increases, Gold often trades in a range while awaiting the report. |
| 1 Day Before | Liquidity sweeps become common and false breakouts increase. |
| NFP Release (First 15–30 min) | Largest spreads and fastest moves of the month. Initial move frequently exceeds normal intraday volatility. |
| Same Day (After 30–90 min) | Market begins pricing the true macro implication rather than the headline reaction. |
| 1–3 Days After | Strong directional continuation if NFP significantly changes Fed expectations; otherwise Gold often retraces back into the prior range. |
 Historical Tendencies
| NFP Outcome | Typical USD Reaction | Typical Gold Reaction |
|---|---|---|
| NFP Much Stronger than Expected | USD ↑ | Gold ↓ |
| NFP Much Weaker than Expected | USD ↓ | Gold ↑ |
| In-line with Forecast | Small USD move | Gold often remains range-bound |
| Mixed Payrolls + Unemployment | Whipsaw | High volatility without immediate trend |
What Usually Happens Before and After NFP
- 3 Days Before: Position reduction by institutions, narrower ranges, increasing implied volatility.
- NFP Day: Often the highest volatility trading session of the month.
- 1–3 Days After: The market generally establishes the true weekly direction once spreads normalize and Fed expectations are reassessed.
Key Pointers: How to Trade Carefully After NFP Data
- ⏳ Wait 15–45 minutes after the NFP release before making any trading decision.
- 📈 Allow at least $25–$40 of price movement before considering an entry.
- 📊 React to confirmed price action, not to predictions or expectations.
- 💰 Risk no more than 1% of your total trading capital on the complete trade setup.
- 📌 Maintain $10 price gaps between entries to avoid overexposure.
- 🔢 Limit your setup to 5 planned trades instead of averaging aggressively.
- 🚫 Avoid large lot sizes during high-impact news events.
- ⚠️ Expect wide spreads, slippage, and liquidity sweeps immediately after the release.
- 🌍 Remember that geopolitical headlines can trigger sudden $60–$100 price gaps.
- 📅 Be prepared for a Monday reaction to Friday’s NFP, including opening price gaps.
- 🕒 Trade during the appropriate market session and monitor major session overlaps.
- 🎯 Respect important support and resistance (price zones) before entering trades.
- 📍 Follow PR Cluster Zones for confirmation instead of chasing price.
- 🔗 Monitor key market correlations including:
- DXY (US Dollar Index)
- USDJPY
- US10Y Treasury Yield
- Crude Oil
- Risk Sentiment
- ❌ Do not open multiple positions at the same price level.
- 🧠 Stay disciplined and avoid emotional or impulsive trading after the data release.
- 🛡️ Capital preservation should always take priority over chasing quick profits.
- ✅ Let the market establish direction first, then trade with the trend.
- 📋 Always have a predefined entry, stop-loss, and exit plan before executing any trade.
- 🎯 Consistency comes from Discipline + Patience + Risk Management, not prediction.
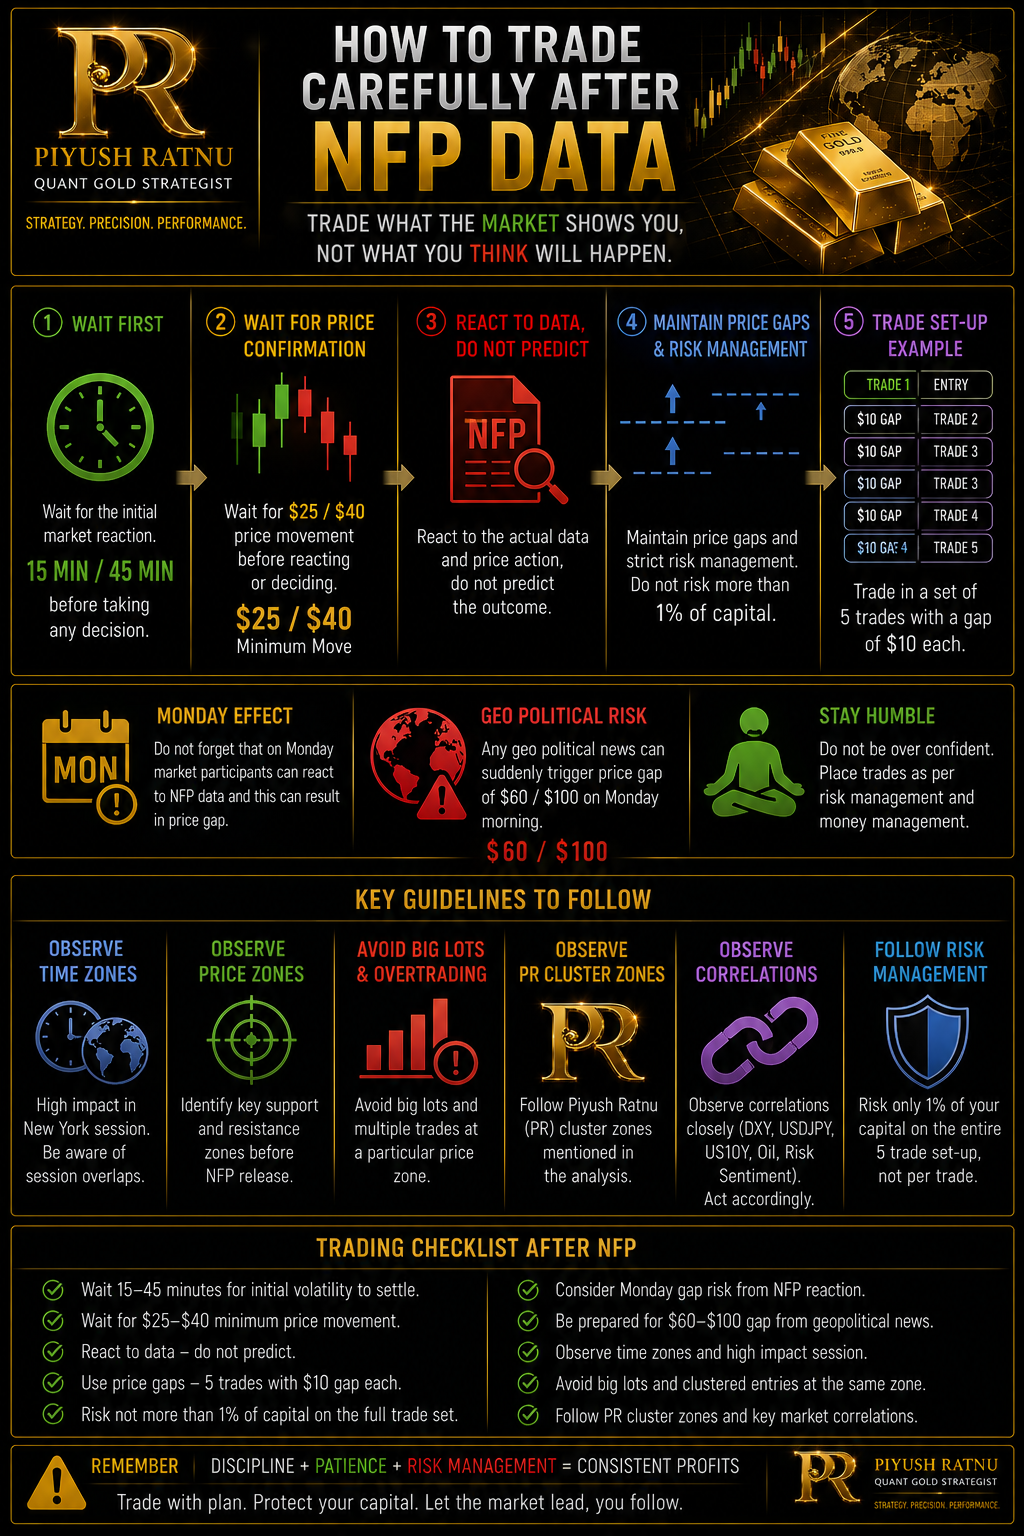
The above market research and data analysis highlights the importance of disciplined execution around high-impact economic events, particularly Nonfarm Payrolls (NFP), and the factors that influence XAU/USD price behavior.
Key themes include monitoring DXY, USDJPY, US10Y yields, crude oil, and geopolitical developments alongside major support and resistance levels. The framework encourages maintaining disciplined position sizing, using predefined price gaps, avoiding excessive leverage, and focusing on institutional liquidity, correlations, and macroeconomic context. Successful trading is presented as a combination of patience, probability, disciplined execution, and effective capital preservation.
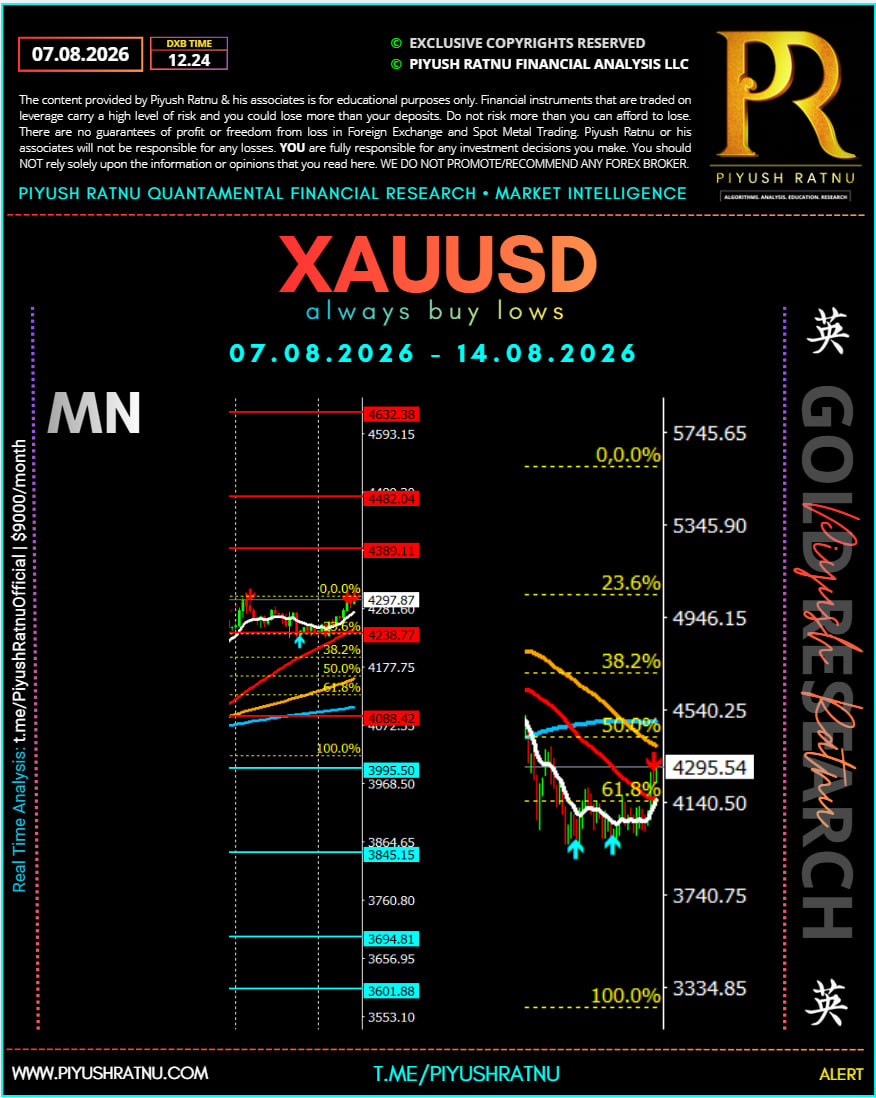
Key Highlights:
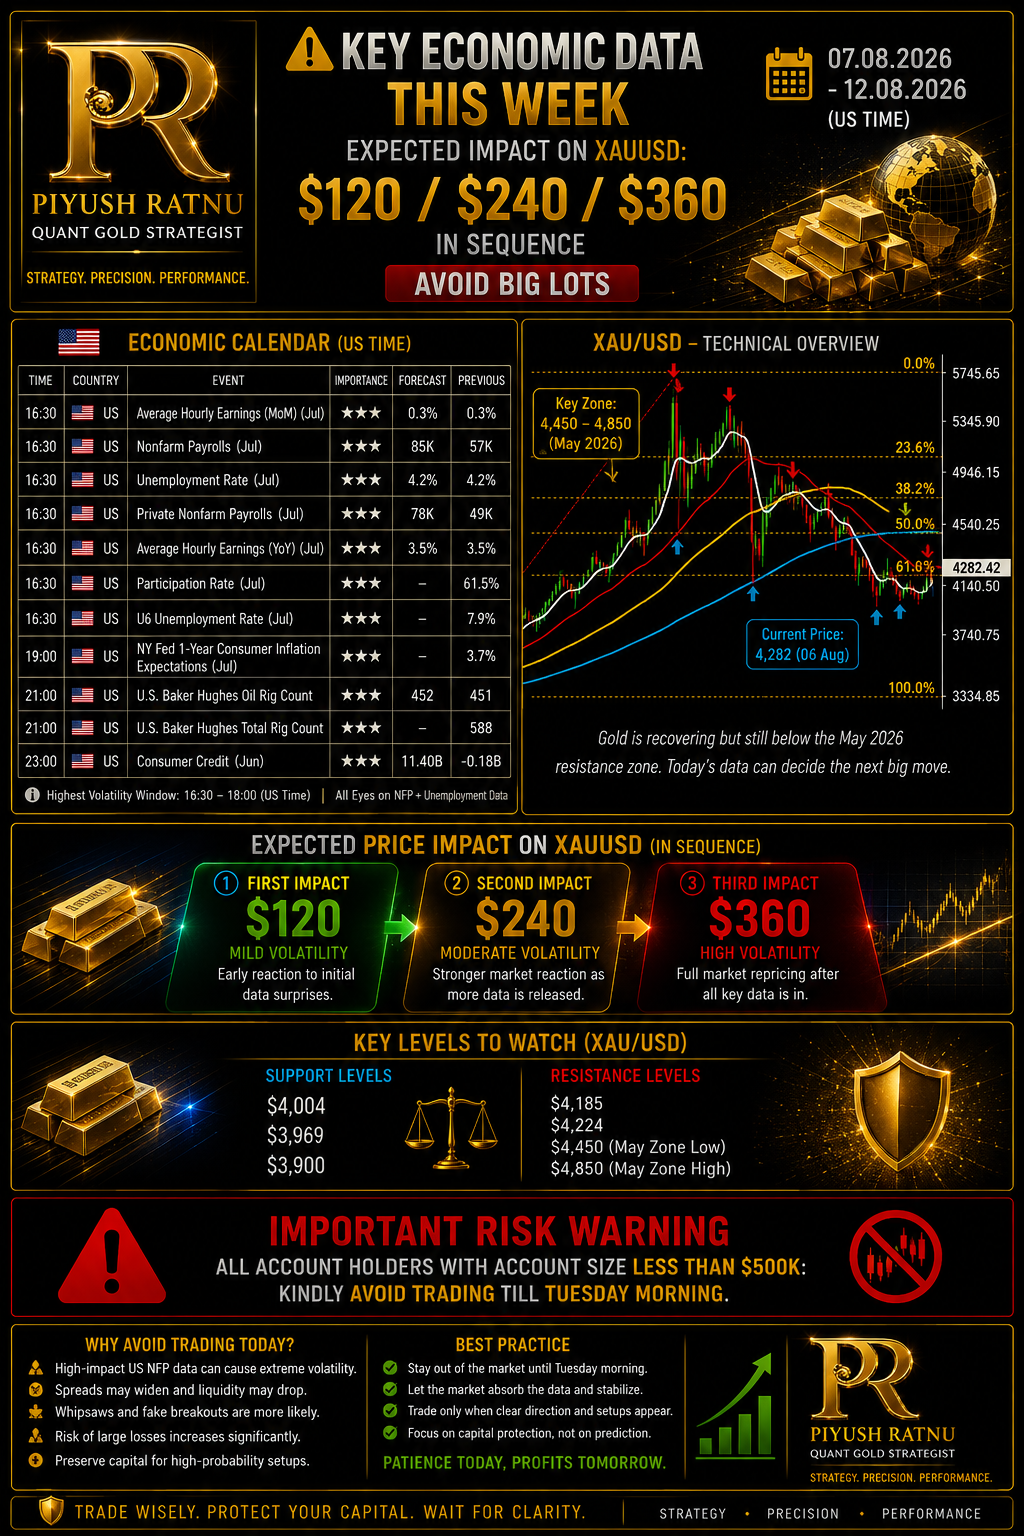
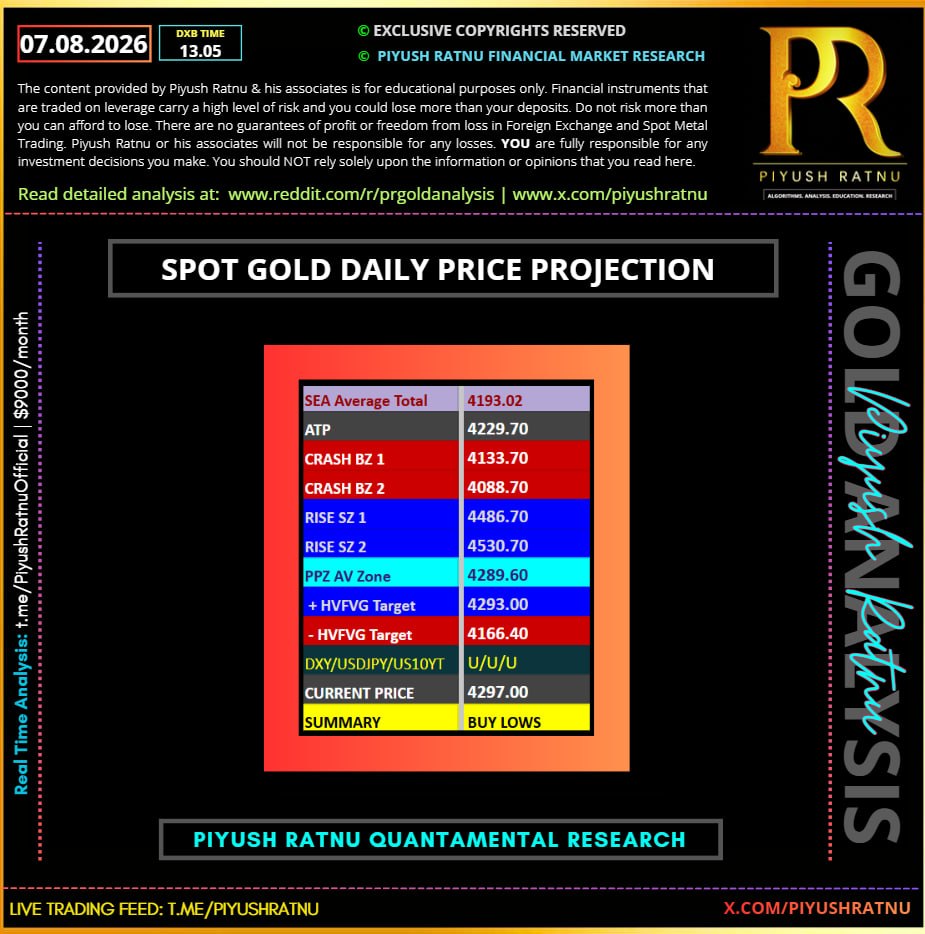
- Current Price: 4297.00
- Overall Bias: BUY LOWS
- Average Equilibrium (SEA): 4193.02
- Average Target Price (ATP): 4229.70
- Crash Buy Zones: 4133.70 and 4088.70
- Upside Expansion Zones: 4486.70 and 4530.70
- PPZ Average Zone: 4289.60
- Immediate Bullish Target (+HFVFG): 4293.00
- Immediate Bearish Target (-HFVFG): 4166.40
- Key Confirmation Factors: DXY, USDJPY, and US10Y Treasury Yield.
The framework emphasizes trading with institutional liquidity, macroeconomic correlations, and disciplined risk management while reacting to confirmed market behavior rather than predicting price movements.
CLICK 2 Read NFP Price Projection by Piyush Ratnu since 2021
Wish you ALL THE BEST!