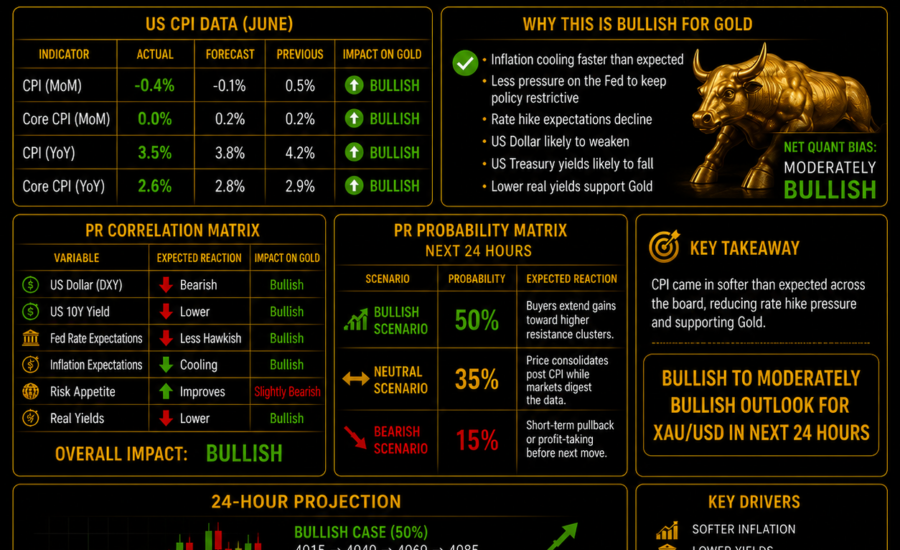
The CPI data is materially softer than expected across the board, which is generally bullish for Gold (XAU/USD).
XAUUSD under price trap: $4069-4085
+ breach = $4104/4141
– breach = $4020/3969
Retail Traders are buying thinking GOLD will come up, in such cases, a surprise US Iran war related news might push GOLD lower.
Always safer to BUY only at lower zones, to avoid getting manipulated from such news. I will BUY at 4020/3969/3939/3883 and exit in net profit in every set, I will not HOLD.
CPI Summary
| Indicator | Actual | Forecast | Previous | Gold Impact |
|---|---|---|---|---|
| CPI MoM | -0.4% | -0.1% | 0.5% | ⭐⭐⭐ Bullish |
| Core CPI MoM | 0.0% | 0.2% | 0.2% | ⭐⭐⭐ Bullish |
| CPI YoY | 3.5% | 3.8% | 4.2% | ⭐⭐⭐ Bullish |
| Core CPI YoY | 2.6% | 2.8% | 2.9% | ⭐⭐⭐ Bullish |
Why this is bullish for Gold
The data suggests:
- Inflation is cooling faster than markets expected.
- The Federal Reserve has less pressure to keep policy restrictive.
- Expectations for future rate hikes decline.
- US Treasury yields are likely to soften.
- The US Dollar typically weakens.
- Lower real yields tend to support non-yielding assets such as Gold.
Overall, this is a supportive macro backdrop for XAU/USD.
PR Correlation Matrix
| Variable | Expected Reaction | Impact on Gold |
|---|---|---|
| US Dollar (DXY) | ▼ Bearish | Bullish |
| US 10Y Yield | ▼ Lower | Bullish |
| Fed Rate Expectations | Less Hawkish | Bullish |
| Inflation Expectations | Cooling | Bullish |
| Risk Appetite | Improves | Slightly Bearish for safe-haven demand, but outweighed by rates effect |
| Real Yields | Lower | Bullish |
Net Quant Bias: Moderately Bullish
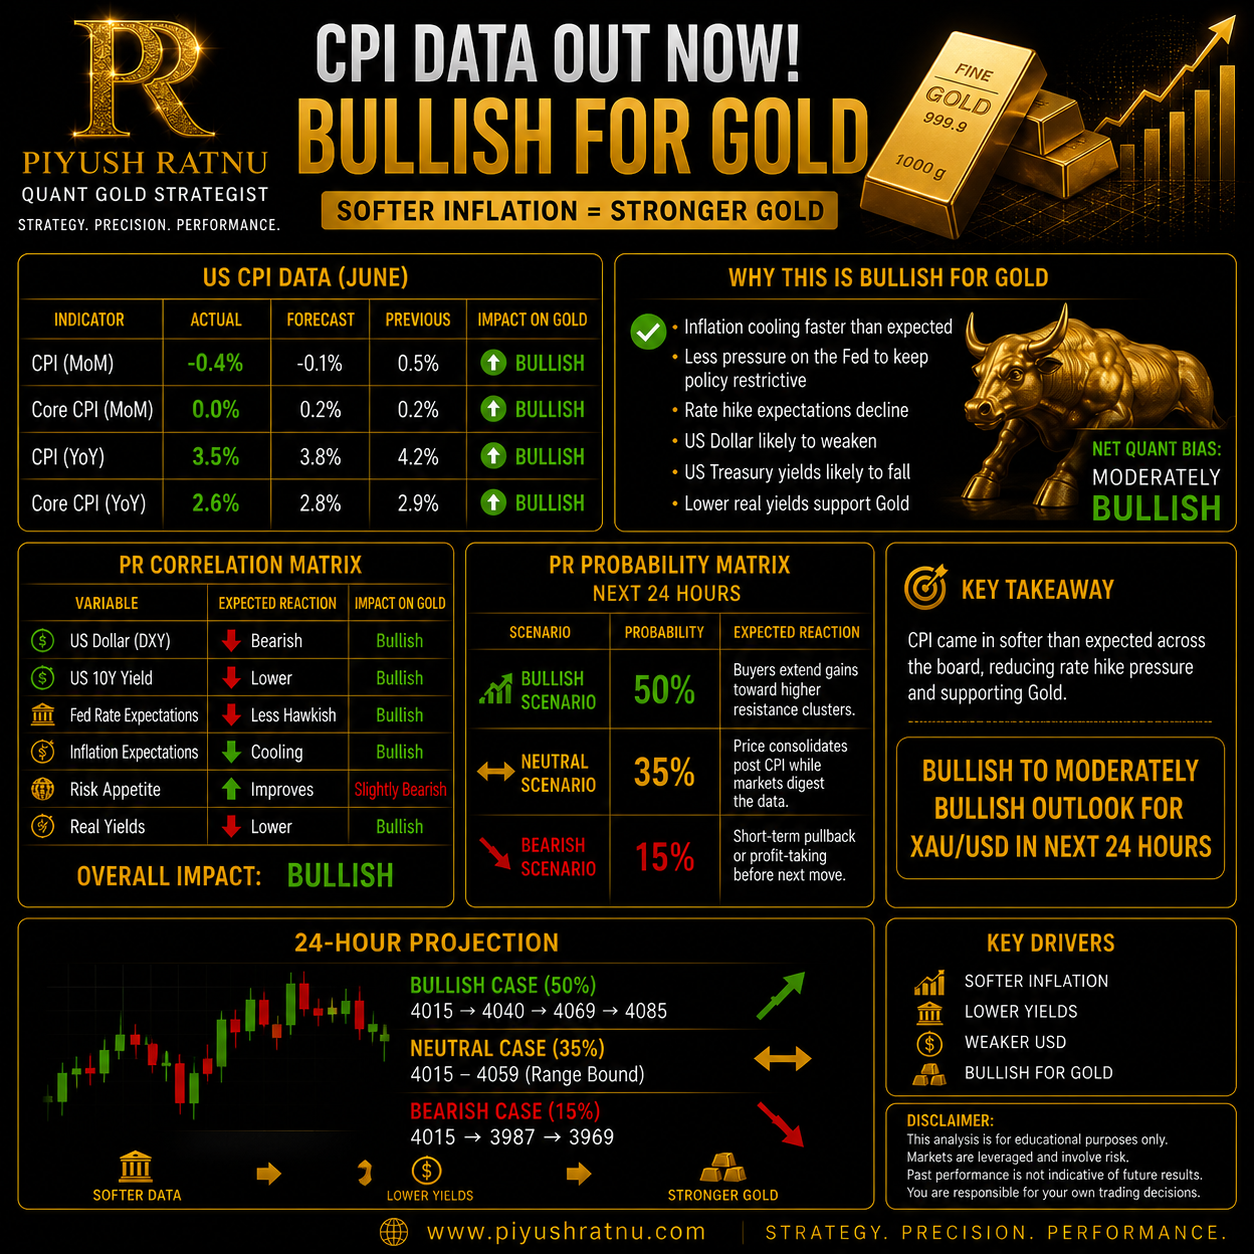
 PR Probability Matrix (Next 24 Hours)
| Scenario | Probability | Expected XAU/USD Reaction |
|---|---|---|
| Strong continuation rally | 50% | Buyers extend gains toward higher resistance clusters. |
| Consolidation after spike | 35% | Price ranges while markets digest CPI and await further Fed commentary. |
| Bull trap / profit-taking | 15% | Short-term pullback before buyers potentially re-enter. |
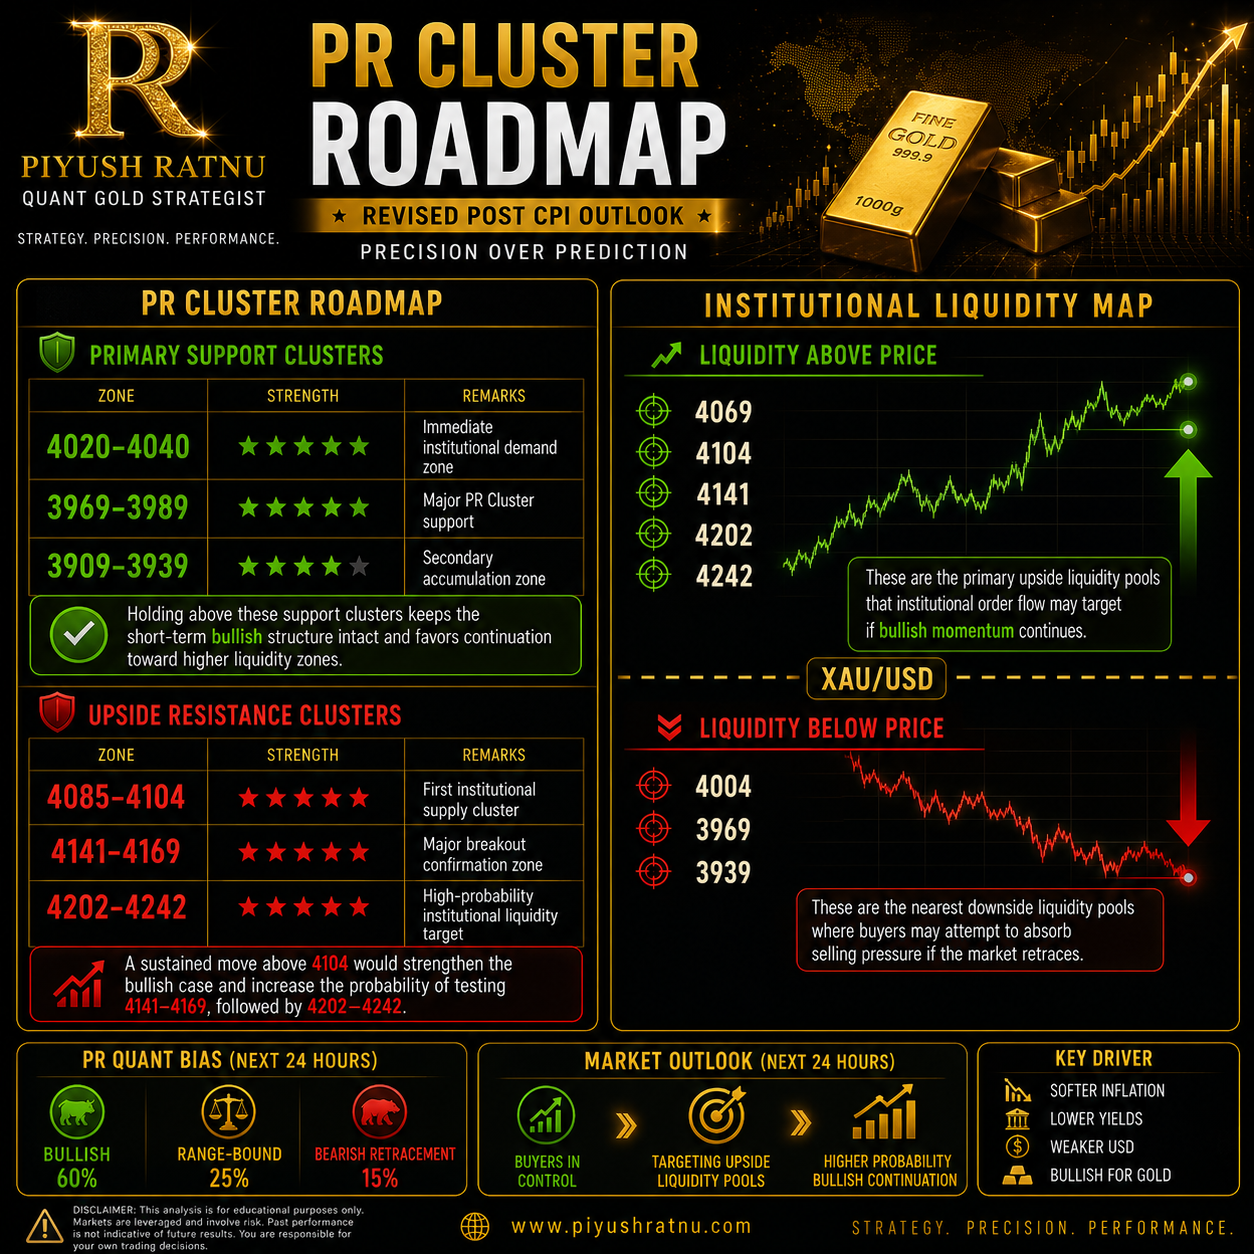
PR Cluster Roadmap
Primary Support
- 4020–4040
- 3969–3989
- 3909-3939
Holding above these levels keeps the short-term bullish structure intact.
Upside Resistance
- 4085-4104
- 4141–4169
- 4202-4242
A sustained move above 4104 would strengthen the bullish case.
Institutional Liquidity Map
Liquidity Above Price
- 4069
- 4104
- 4141
Liquidity Below Price
- 4004
- 3969
- 3939
If buyers remain in control, price often seeks the upper liquidity pools.
24-Hour Projection
Bullish Case (Most Likely)
Probability: 50%
Potential path:
4020 → 4069 → 4085
This is supported by softer-than-expected inflation reducing pressure on the Fed to maintain a restrictive stance.
Neutral Case
Probability: 35%
Expected range:
4020–4069
Markets consolidate after the initial CPI reaction while awaiting additional policy signals.
Bearish Case
Probability: 15%
If the market shifts focus to other risks (such as stronger-than-expected economic data later, hawkish Fed communication, or geopolitical developments boosting the US Dollar), Gold could retest:
4020 → 3969 → 3939
 PR Quant Conclusion
The CPI release shown is clearly softer than consensus, which is typically positive for Gold through its effect on interest-rate expectations, Treasury yields, and the US Dollar. Based on these data alone, the next 24 hours favor a bullish to moderately bullish outlook.
PR Quant Bias (Next 24 Hours):
- 🟢 Bullish: 50%
- 🟡 Range-bound: 35%
- 🔴 Bearish Pullback: 15%
The key technical levels to monitor are 4040, 4069, 4085, and 4104 on the upside, while 4015, 3987, and 3969 remain the principal support zones that would help preserve the current bullish bias.